Closed Deals Report
Q2 2025
Presented by Search Fund Ventures
Prepared by Search Fund Ventures
+1 (847) 220-4815
401 North Michigan Avenue
Suite 1200
Chicago, IL 60611
Table of Contents
About the Data
Data consists of roughly 584 closed acquisitions of businesses between $0.5mm and $5mm in EBITDA in the US. We focused broadly on industries popular among small business acquirers: B2B & B2C Services, Distribution & Logistics, Trade Contractors & Construction, Manufacturing, Diversified Retail, and Healthcare Services.
Data was sourced from BVR DealStats, with primary sources including state-specific MLS, IBBA, and direct reporting from brokers. Since these transactions are reported by brokers, none of these deals were sourced through “proprietary” channels. Reports lag by one quarter, as transactions are often not reported for a few months post-close.
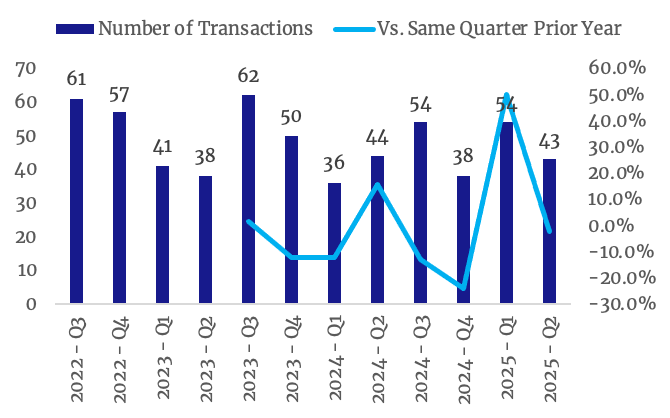
Number of Transactions
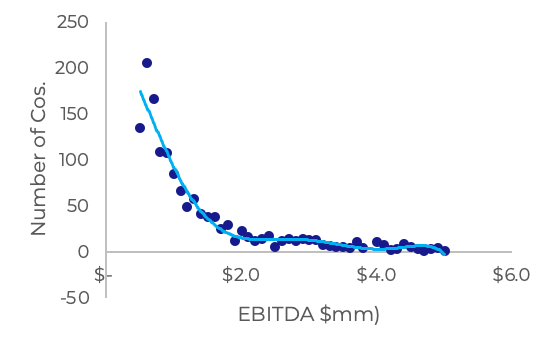
Transactions by Size
Average Company Profile
$8.8mm
Avg Revenue
$1.3mm
Avg EBITDA
1997
Avg Founded
28 yrs
Avg Age
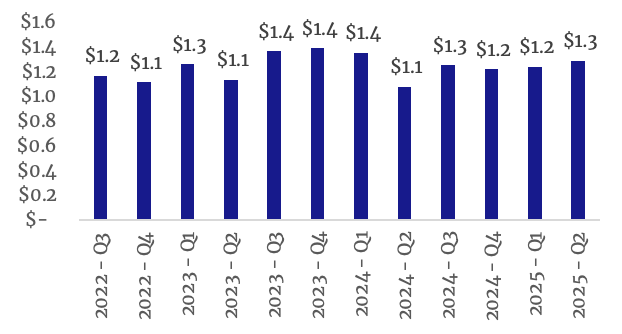
Average target company revenue reached $8.8mm, its highest figure since Q3 2023. Margins and EBITDA profiles have remained stable, with avg. EBITDA at sale landing at $1.3mm for transactions closed in Q2 2025.
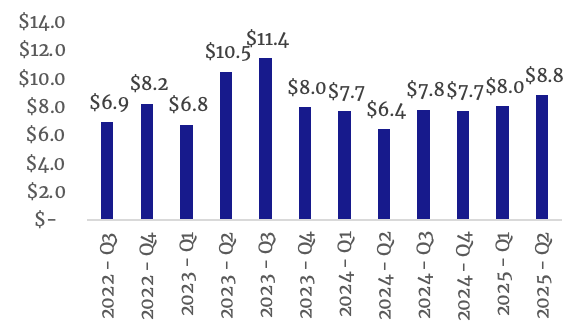
Average Revenue ($mm)
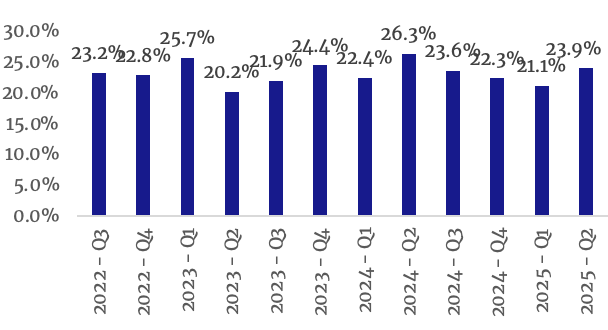
Average EBITDA Margin (%)
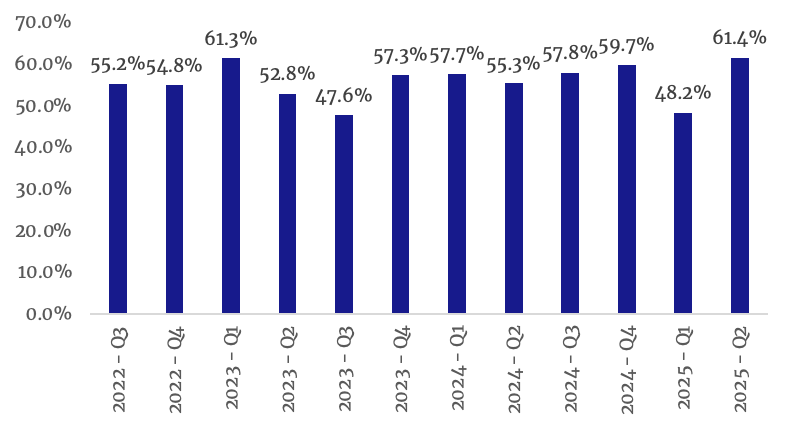
Average Gross Margin (%)
Average EBITDA ($mm)
Average Age
Average Employee Count
Sale Process Metrics
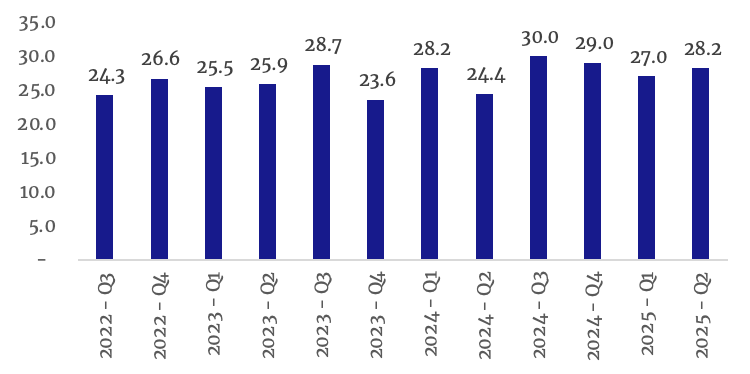
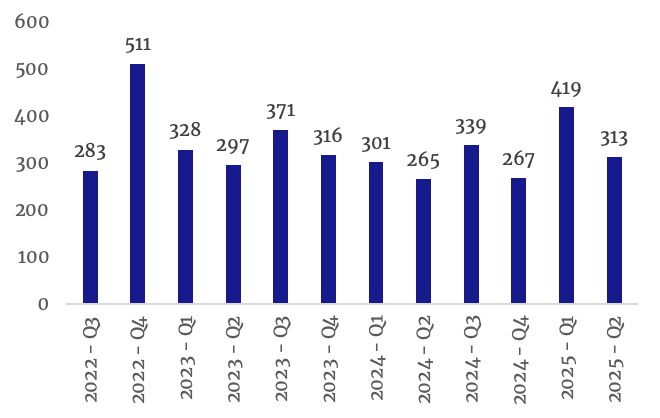
Brokered processes remained within a 9–12 month range. Businesses that sold through brokered processes in Q2 2025 averaged 313 days on market. Over the past 12 quarters, average days to sell has fluctuated between 265 and 511 days.
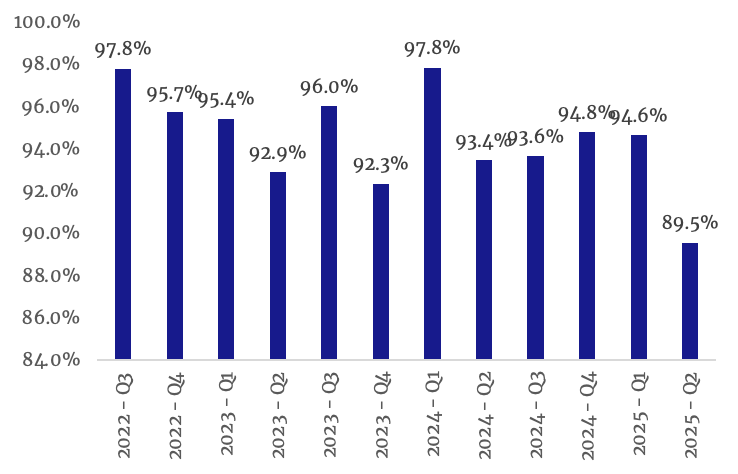
Acquisitions closed this quarter sold 10.5% below asking prices, the widest gap in the past three years. Purchase prices have fluctuated between 89.5%–97.8% of asking since Q3 2022.
Average Days to Sell
Purchase Price (% of Asking Price)
Acquisition Financing
584
Total Deals
151
Deferred Consideration
(seller note / rolled equity)
44
Included Earn-Out
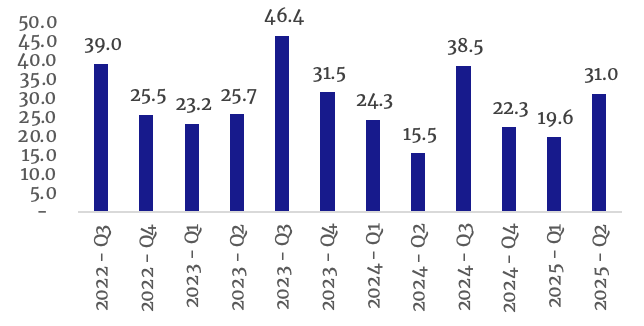
Deferred consideration ranged from 9.9% to 34.8% of total acquisition capital at its recent peak in Q4 2022. Limited data and outsized earn-outs worth 50%–120% of purchase price drove metrics higher in Q4 2023 and Q1 2025.
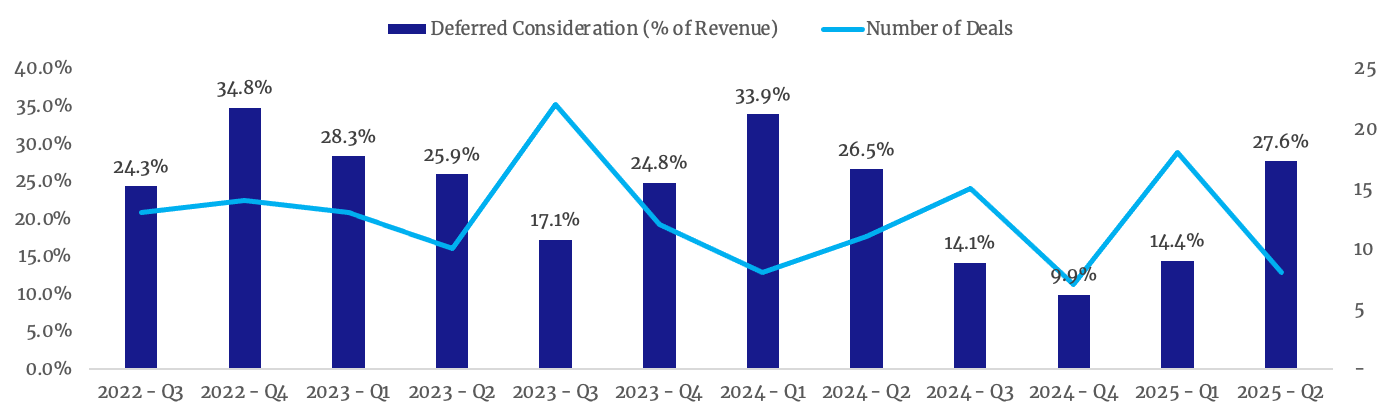
Deferred Consideration (% of Purchase Price)
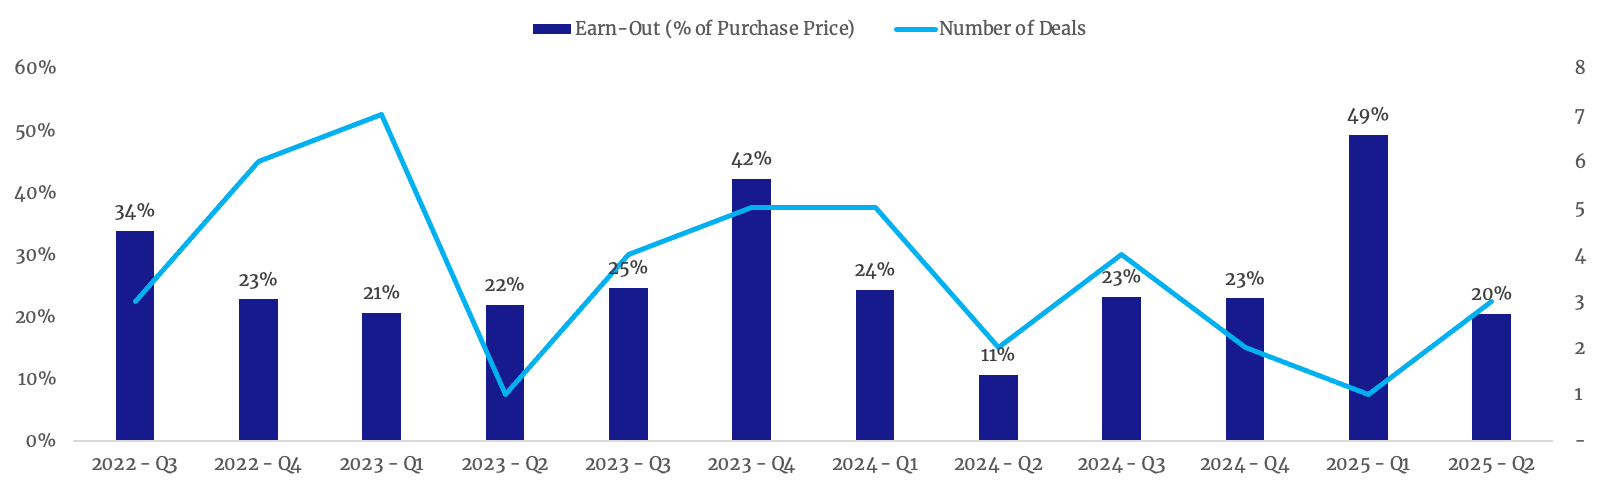
Earn-Out (% of Purchase Price)
Transaction Structure & Target Entity
Asset deals have consistently been more common than stock deals. S-Corps remain the most common entity structure, followed by LLCs and C Corporations. In many cases, acquisitions of an S-Corp require a reorganization to accommodate multiple share classes.
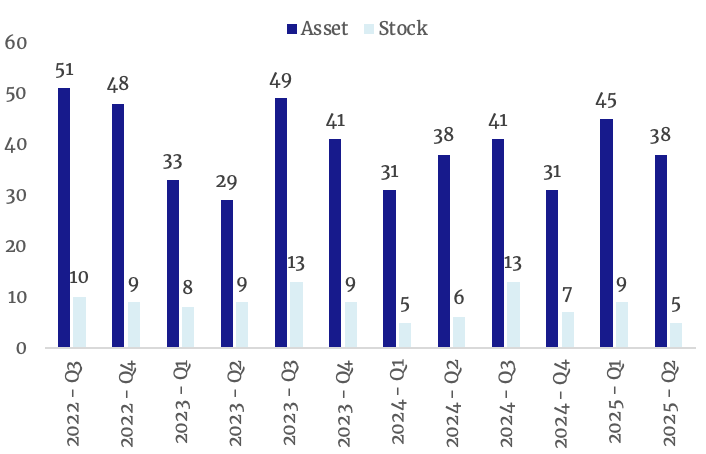
Transaction Structure (Asset vs. Stock)
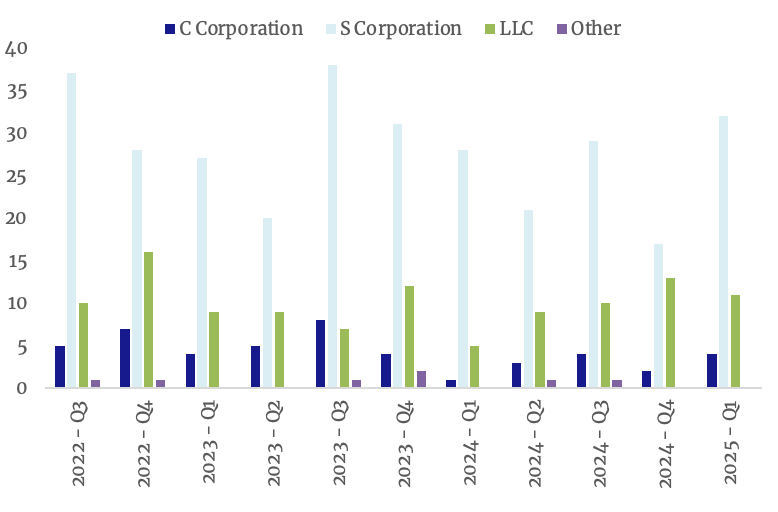
Target Entity Type
Average EBITDA Growth
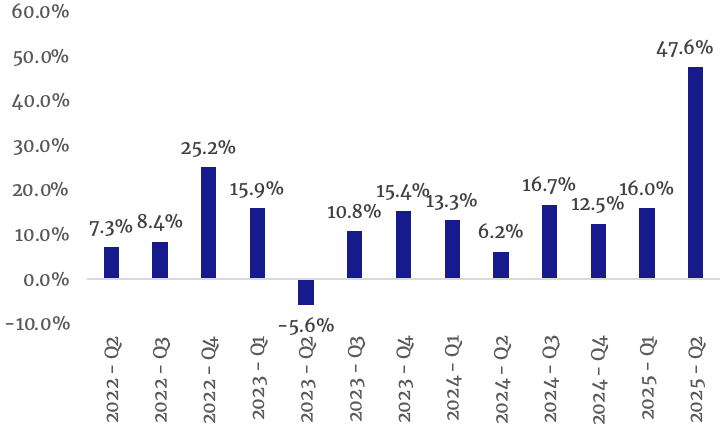
Since Q2 2022, targets have consistently seen tremendous earnings growth vs. the prior 3 years. While EBITDA was often below $1mm three years prior to sale, TTM EBITDA was consistently above $1mm across all quarters in our sample set.
Year-over-year growth appears to have tapered for acquisition targets in Q1 and Q2 2025, as compared to the same quarters in 2023 and 2024.
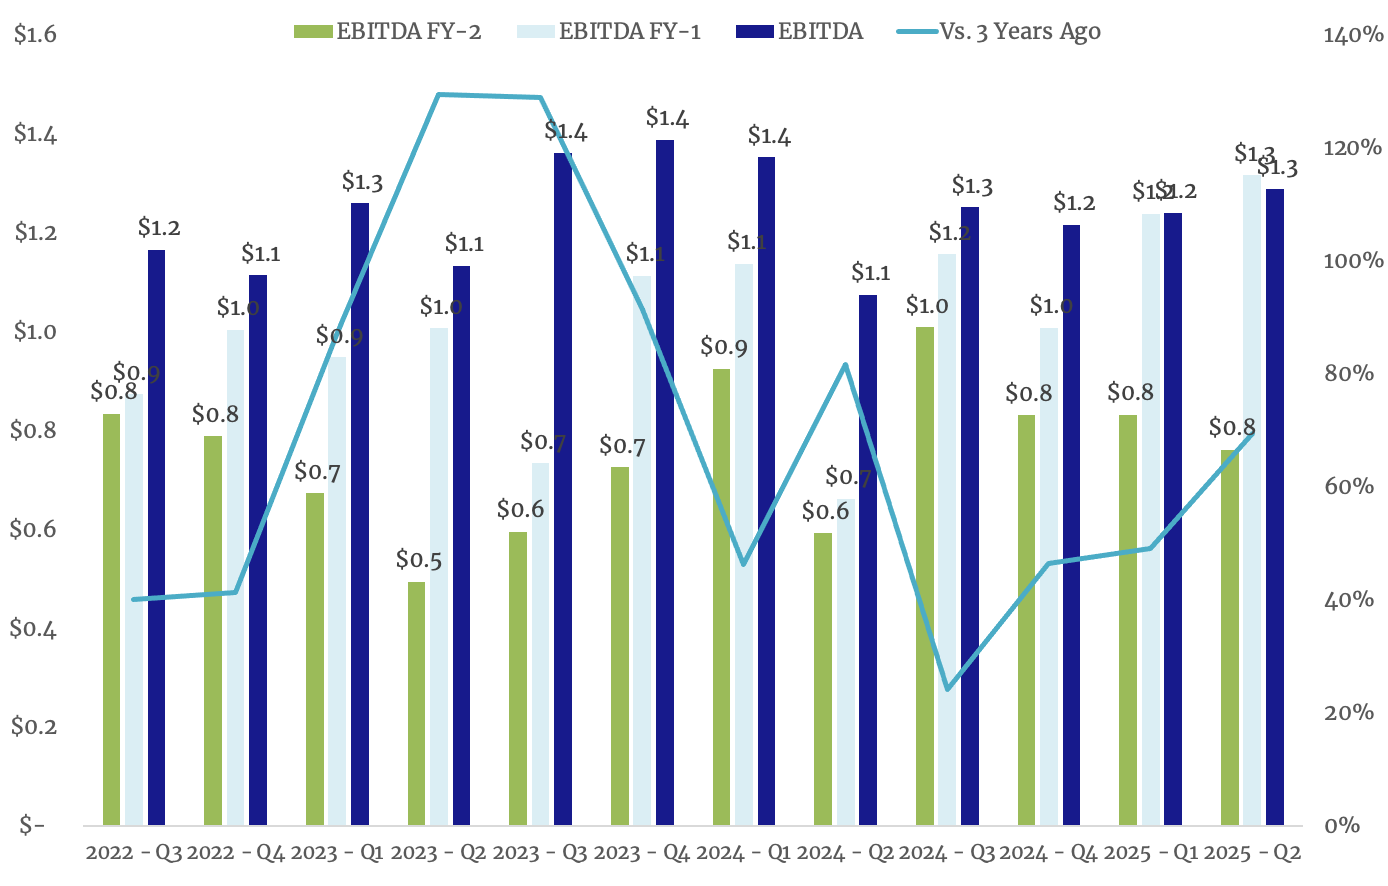
Average EBITDA Growth (TTM vs. 3-Year Prior)
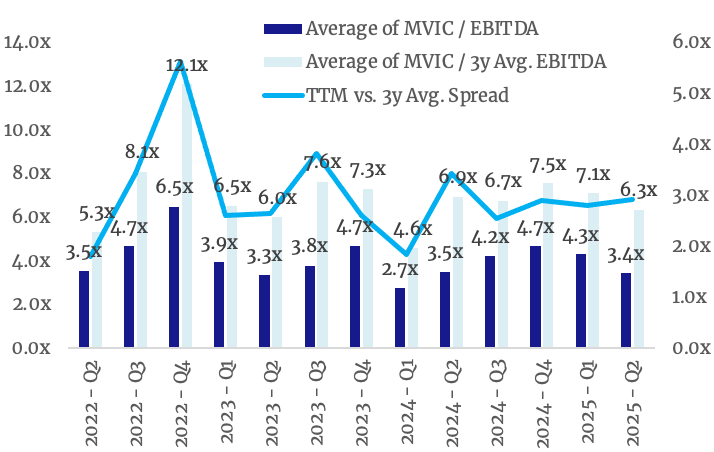
Average Purchase Multiples
3.3x
TTM EBITDA Multiple
Lowest in past 12 quarters
3.9x
3Y Avg. EBITDA Multiple
0.2x–1.3x premium over TTM
The difference between TTM and 3-year average multiples has declined steadily over the past 12 quarters as growth rates have slowed. Three transactions closed below 2.0x EBITDA, bringing down the average.
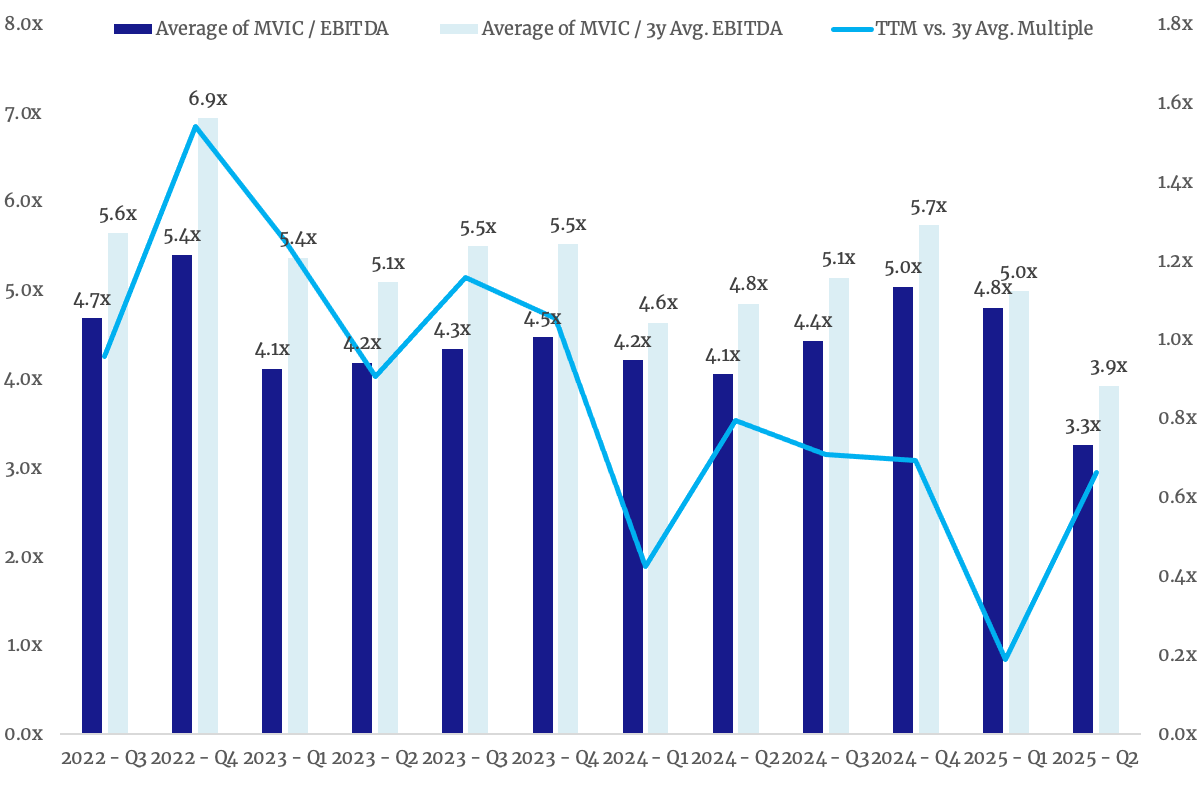
TTM EBITDA Multiple vs. 3Y Avg. EBITDA Multiple
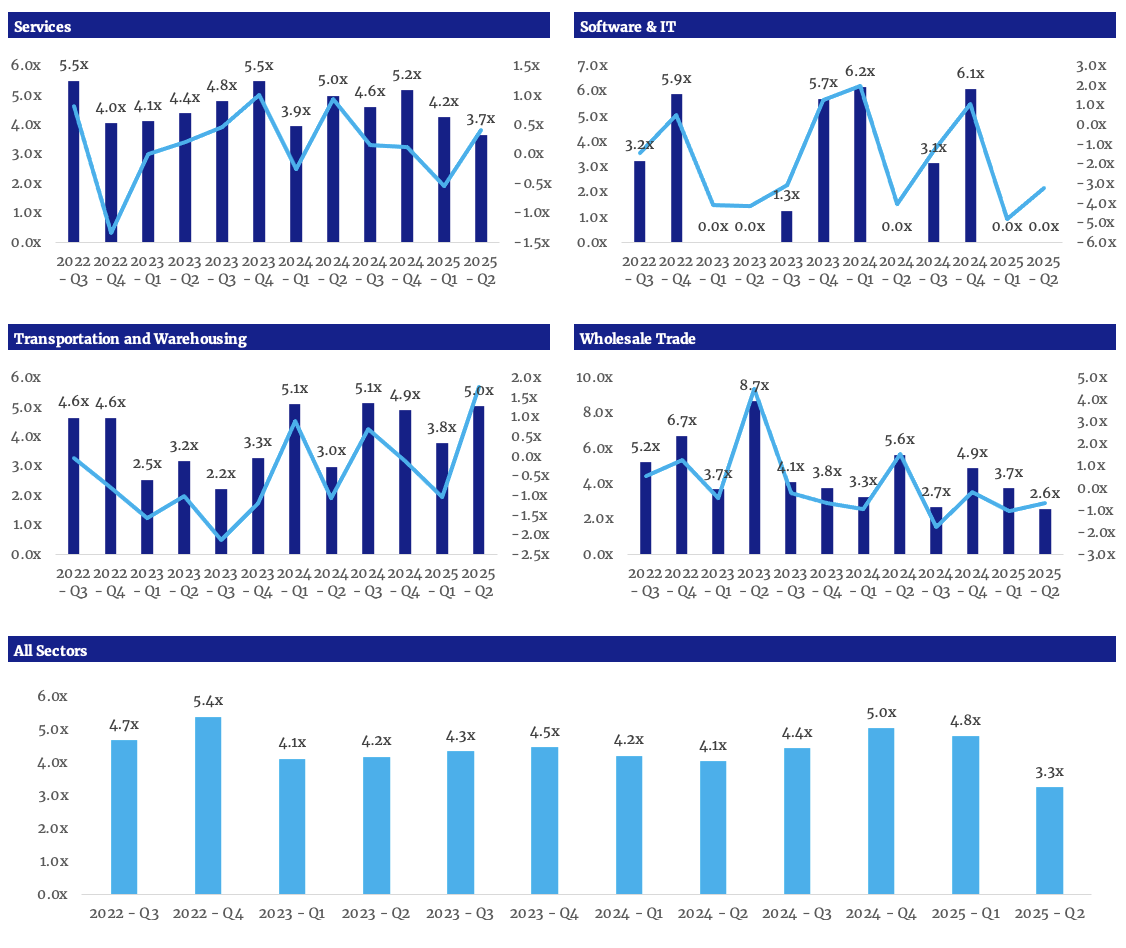
Purchase Multiples by Industry
Q2 saw fewer healthcare deals and a decline in manufacturing deals versus prior quarter. Construction multiples continued to decline from a Q3 2024 peak, but increased relative to broader asset class multiples. Retail saw a resurgence with a 3.6x average EBITDA multiple. Services businesses saw the lowest multiples at 3.7x across 9 transactions. The sole transportation & warehousing deal eclipsed 5.0x.
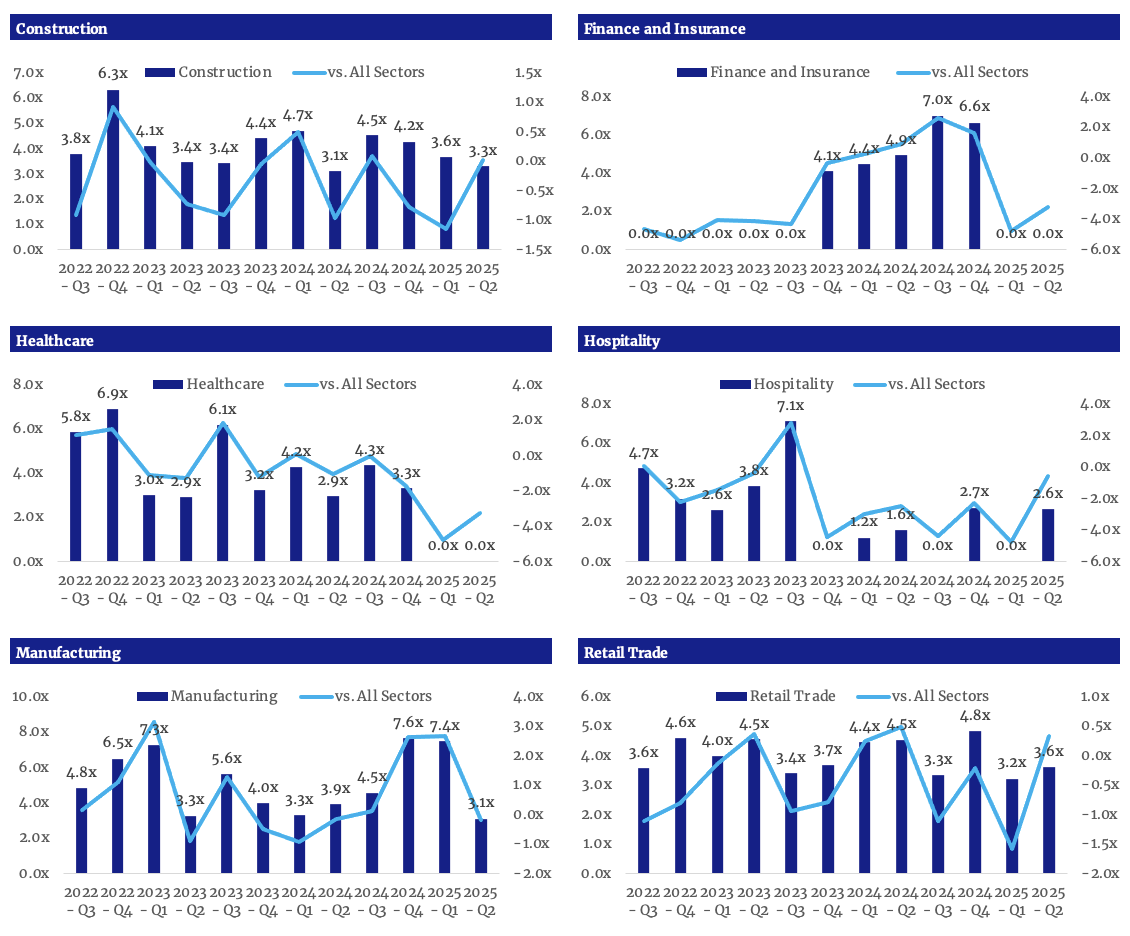
Purchase Multiples by Industry Category
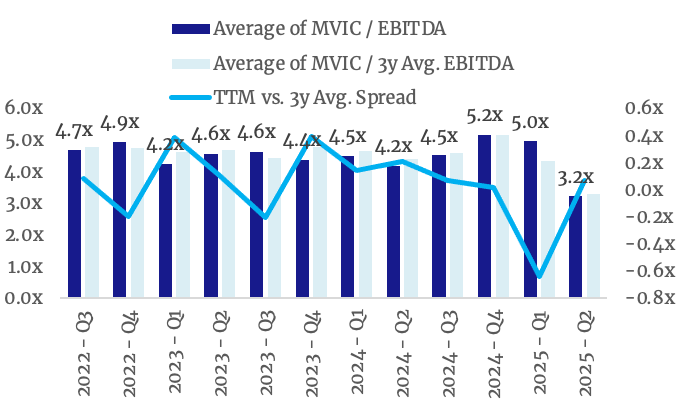
Purchase Multiples by Industry (Cont'd)
Peak vs. Stable Earnings
Purchase multiples track more closely to TTM EBITDA than 3-year averages. For businesses with an earnings peak (TTM EBITDA 30%+ above prior 3Y average), multiples vs. 3Y average tended to be 3.0x greater than TTM multiples.
Stable earnings businesses commanded a 0.4x multiple premium over businesses that experienced a peak.
TTM vs. 3Y Avg. Multiple (Peak Earnings)
TTM vs. 3Y Avg. Multiple (Non-Peak Earnings)
Purchase Multiples by Size
By Revenue
Companies above $5mm revenue saw a 0.3x premium vs. those below $5mm. Revenue size had a modest but measurable impact on valuation.
By EBITDA
EBITDA amount had negligible impact on purchase price. Businesses below $1mm EBITDA sold for similar multiples to those above $1mm.
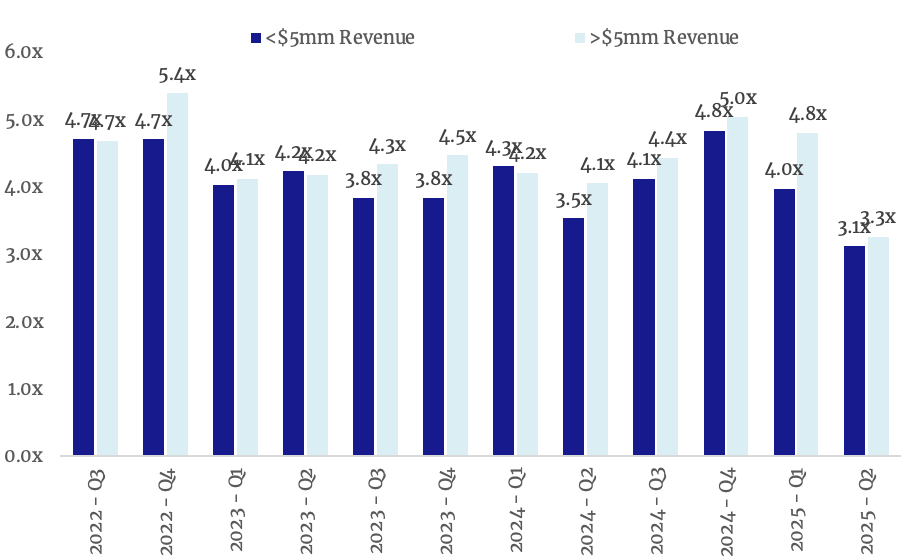
Purchase Multiples by Size (Revenue)
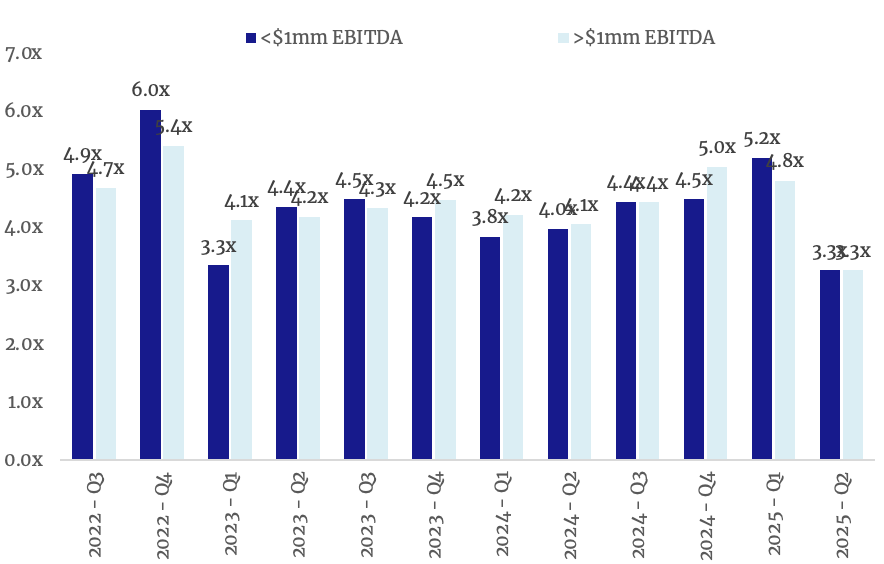
Purchase Multiples by Size (EBITDA)
Net Working Capital & Net Asset Value
10%–20%
Typical NWC range (% of purchase price)
18%
Q2 2025 NAV (% of enterprise value)
Net working capital peaked this quarter on the back of two transactions with outsized NWC figures (>50% of EV). NAV has fluctuated between 7.3% and 22.9% of enterprise value over the past 12 quarters.
Net Working Capital (% of Purchase Price)
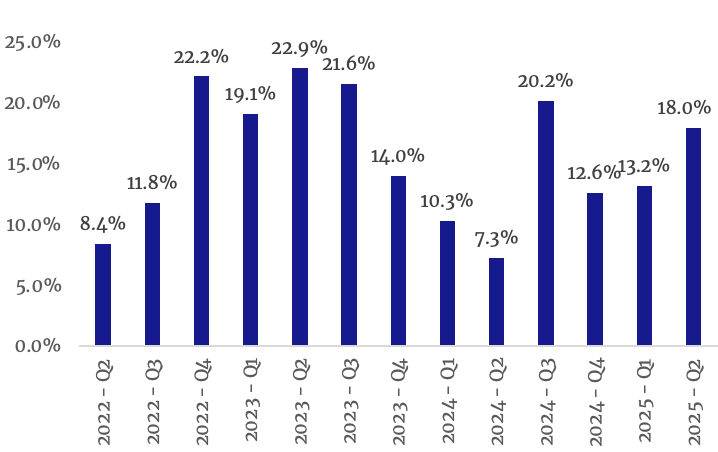
Net Asset Value (% of Enterprise Value)
About The Authors

Sean Smith
Managing Partner
Search Fund Ventures
Sean brings extensive experience in search funds and SMB acquisitions. He has built and scaled multiple businesses and now focuses on connecting investors with high-quality deal flow in the lower middle market.

Nicholas Steele
Co-Founder, CTO
SMB Investor Network
A serial entrepreneur and anchor investor in Search Fund Ventures, Nicholas brings his expertise in technology and small business entrepreneurship to the lower market private equity space.
Get investable deals in your inbox
- Vetted SMB acquisitions starting at $10k for accredited investors
- Co-invest alongside experienced operators on transparent terms
- Quarterly market data, deal sheets, and diligence resources
This report is for accredited investors only. Informational use only. Not intended for reproduction, copying or distribution without expressed written consent of SMB Investor Network. Not intended to provide investment advice nor does it constitute a solicitation or an offer to buy or sell any security or other financial instrument. Nothing contained in this website constitutes tax, legal, insurance or investment advice. Investing in securities in private companies is speculative and involves a high degree of risk. The recipient must be prepared to withstand a total loss of your investment. We strongly encourage the recipient to complete their own independent due diligence before investing in securities or financial instruments including obtaining additional information, opinions, financial projections and legal or other investment advice. SMB Investor Network is not affiliated or associated with, or endorsed by, any of the companies mentioned herein and the information included has not been checked or confirmed in any way by the same companies. All service marks or trademarks are the property of their respective owners.