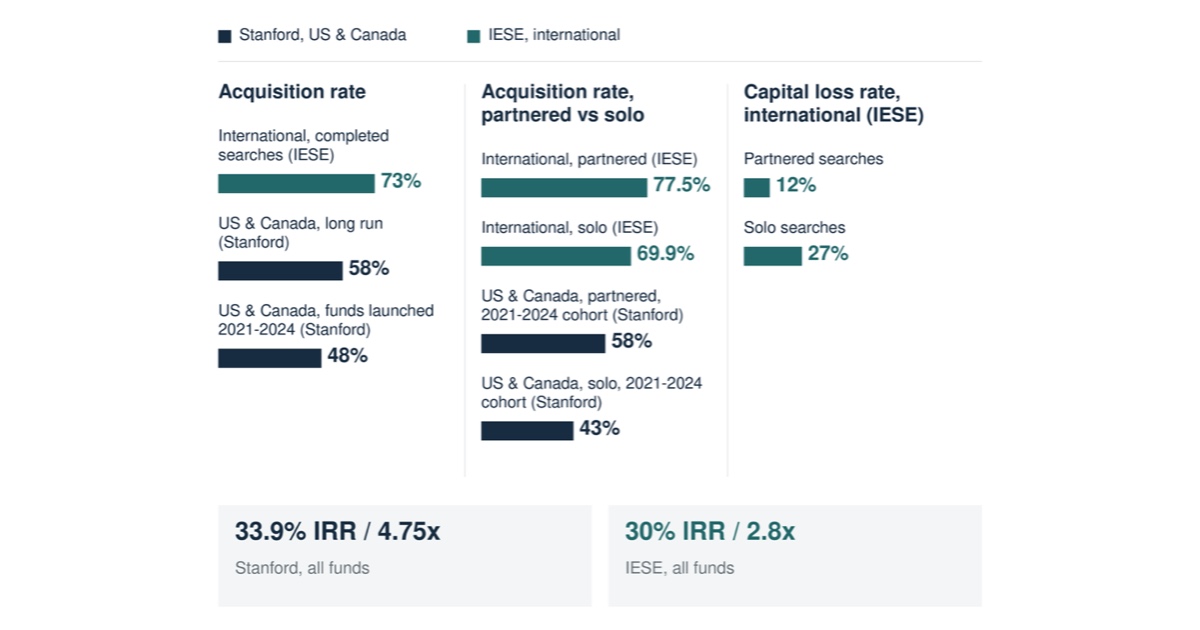
Stanford and IESE describe the same search fund model and get different outcomes. Stanford's 2026 study covers the United States and Canada. IESE's 2026 study, published three months later, covers everyone else. Most readers pick one. Read side by side, they differ on acquisition rates, on returns and on what a partner is worth, and they agree on the mechanism behind all three.
These are asset-class findings from academic research. They are not SMB Investor Network results, and past asset-class performance does not guarantee future results.
The two samples
Stanford tracks 862 core search funds launched in the United States and Canada since 19841. IESE tracks all 492 known core search funds formed elsewhere, across 48 countries2. Europe accounts for 291 of them and Latin America for 142, so roughly 88% of the international sample sits in those two regions2.
Both studies now measure through December 31, 2025, and both report pre-tax returns to the investors who funded the search. The headline numbers:
| Stanford, US and Canada | IESE, international |
|---|
| Funds in the study | 862 since 19841 | 492 in 48 countries2 |
| Aggregate IRR | 33.9%1 | 30%2 |
| Aggregate ROI | 4.75x1 | 2.8x2 |
| Concluded searches that acquired | 58% long run, about 48% for 2021 to 2024 launches3 | 73%4 |
| Partnered vs solo acquisition rate | 58% vs 43%, 2021 to 2024 cohort5 | 77.5% vs 69.9%6 |
| Searchers with an MBA | 80% of the recent cohort7 | 60% of new principals8 |
The IRRs sit four points apart. The multiples do not. That gap is the interesting part, and it comes up again in the returns section.
Takeaway: same model, same cutoff date, different populations. Keep the region attached to every number.
Acquisition rates: a 15-point gap
73% of concluded international searches ended in an acquisition4. In the United States and Canada the long-run figure is 58%, and funds launched from 2021 to 2024 are closer to 48%3. Comparing the international rate with the recent US cohort, the gap is roughly 25 points. Against the long-run US rate it is 15.
Both rates are falling. IESE's 2024 edition showed 79%4. Terminated international funds rose from 14% of the sample to 23% over the same two years4. The international rate is moving toward the US number.
The timing data is where IESE adds the most. International searchers who closed a deal signed their first LOI by month six on average and submitted 4.6 LOIs in total9. Searchers who ended without a deal submitted 8.2 LOIs, with the first typically signed around month eight9. More offers did not produce more closings.
Stanford points the same way. In its 2021 to 2024 cohort, searchers who signed an LOI within six months acquired at a 74% rate5.
Here is how a search fails on this data:
- The first LOI comes late. The search burns its first year building a pipeline instead of engaging with a target.
- LOIs pile up without closing. Volume replaces depth. Recent international searchers most often blamed adverse diligence findings (59%) and valuation disagreements (41%) for LOIs that did not close9.
- The calendar runs out. By the time a viable target appears, the searcher is near the end of the funded period.
For more on what a failed search costs an investor, see what broken searches mean for LPs.
Takeaway: in both studies, early engagement with a target predicts an acquisition better than offer volume does.
Returns: the US headline rests on a thin tail
Stanford's 33.9% IRR and 4.75x ROI1 are aggregate figures, and a small number of very large outcomes carry them. Remove the funds that returned 10x or more, and the aggregate falls to 27% IRR and 2.8x10. Remove the top 10% of funds by ROI, and it falls to 20% and 2.1x10.
IESE's aggregate is 30% IRR and 2.8x2. That multiple matches Stanford's figure with the 10x funds removed. Internationally, the largest single band of partnered outcomes, 37%, returned between 2x and 5x6. The international results look like the US model with fewer outliers.
There is a caveat, and IESE states it. Much of the international portfolio was acquired recently, and IESE says that may partly explain the gap with Stanford's returns4. Younger companies have had less time to compound or to produce a 10x exit. The median international acquisition was valued at 1.1x invested capital, while the best fund had reached 23.8x2. The tail may still be forming.
Either way, the ex-outlier figure is the more conservative one to plan around. A portfolio of a handful of search funds is unlikely to own the funds that drive an aggregate. Our piece on search fund return dispersion shows how much of the spread sits in a few outcomes.
Takeaway: underwrite to the ex-outlier number. Treat a home-run fund as upside, not as the plan.
Partnering: fewer zeros, not bigger wins
Just over a third of Stanford's recent cohort searched with a partner7. Internationally, partnerships are 37% of all funds and 31% of the 2024 and 2025 cohort8. In both regions, partners close more often. Stanford's 2021 to 2024 cohort acquired at 58% when partnered and 43% when solo5. IESE reports 77.5% and 69.9%6.
IESE adds the figure that matters most to an LP. Among international acquisitions, solo searches lost investor capital 27% of the time and partnered searches 12%6. IESE found no generalizable difference in returns above 5x or 10x, and it says the data support neither a general preference for partnerships nor a general benefit from them6.
Read plainly, a partner did not make the good outcomes better. Partnered searches had fewer losses.
Takeaway: a partnered search changes the left tail of outcomes, not the right tail.
One smaller difference: the MBA pipeline
80% of Stanford's recent cohort hold an MBA7. Among new international principals, the figure is 60%, down from 71% across the whole IESE study8. Outside North America, the model is spreading beyond the business-school pipeline faster. Neither study yet shows whether that changes outcomes. It is worth watching in the next editions.
Where the studies agree
The two studies disagree on rates and multiples. They agree on the mechanism. Speed to a signed LOI and a second searcher in the deal are what separate funds that return capital from funds that do not596.
Before comparing these figures with any other study, check the population and the exclusions. Our guide to search fund study comparability walks through that check.
What I'd check
- Which return figure the pitch uses. If a searcher or sponsor quotes 33.9%, ask what the plan looks like at 2.8x and 27%10.
- When the first LOI is expected. Ask the searcher for a target date. Month six is where the acquirers in both studies sat59.
- How many LOIs have died, and why. A high count with no close is the pattern of searches that ended without a deal9.
- Whether there is a partner. If not, ask what replaces the second person in diligence. The solo loss rate internationally was more than double the partnered rate6.
- Which region's data applies. Use Stanford for a US or Canadian search and IESE for an international one. Don't borrow the more flattering number.
Source notes
- Stanford GSB, 2026 Search Fund Study: Selected Observations, via the ClearlyAcquired recap:1,10,3,5,7.
- Kowalewski, Naranjo, Kelly and Simon, International Search Funds 2026: Selected Observations, IESE Business School:2,4,9,6,8.
Continue with search fund return dispersion, or return to the search fund returns research guide.