Search Fund Terms: What an LP Nets at 2x, 3x, 5x

By , Co-Founder and CTO, SMB Investor Network

8 min read

The same business outcome pays an LP very different amounts depending on the deal structure. In this illustrative model, terms create little difference at 1.5x and a much larger gap at 5x.

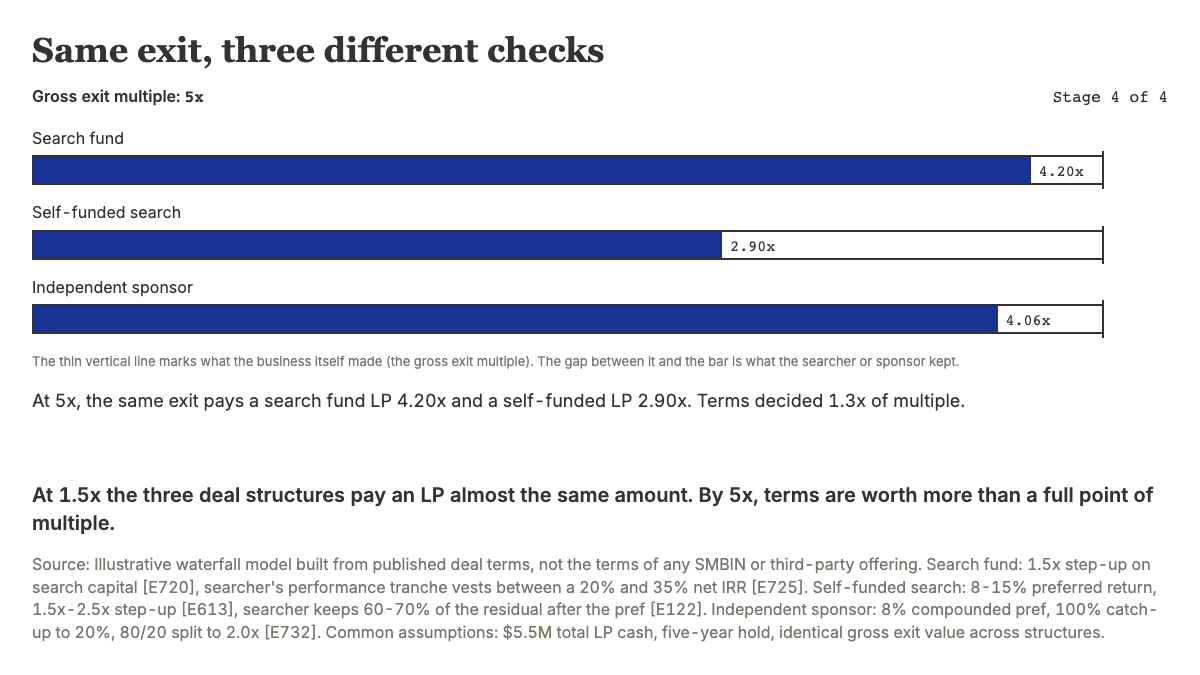
At a 5x gross return on an illustrative $5.5M of LP cash, a search fund LP nets 4.20x, an independent sponsor LP nets 4.06x, and a self-funded search LP nets 2.90x [illustrative model]. At 1.5x, all three pay almost the same amount. The 5x gap is not the business performing differently. It is the contract.

Same business, three different checks

The figure below walks through one illustrative exit at four gross multiples: 1.5x, 2x, 3x and 5x. Watch the bar for each structure move against the thin reference line, which marks what the business itself made. The gap between the line and the bar is what the searcher or sponsor kept.

Same exit, three different checks

Grouped bars for search fund, self-funded search and independent sponsor LP net multiples at four gross exit multiples. At 1.5x all three pay about 1.5x. At 5x the search fund LP nets 4.20x, the independent sponsor LP nets 4.06x and the self-funded LP nets 2.90x.

Gross exit multiple: 1.5x

Search fund

0.00x

Self-funded search

0.00x

Independent sponsor

0.00x

The thin vertical line marks what the business itself made (the gross exit multiple). The gap between it and the bar is what the searcher or sponsor kept.

At 1.5x gross, the three structures pay an LP almost the same amount. Losses and small gains are shared the same way.

0:00 of 0:16
At 1.5x the three deal structures pay an LP almost the same amount. By 5x, terms are worth more than a full point of multiple.

Source: Illustrative waterfall model built from published deal terms, not the terms of any SMBIN or third-party offering. Search fund: 1.5x step-up on search capital1, searcher's performance tranche vests between a 20% and 35% net IRR2. Self-funded search: 8-15% preferred return, 1.5x-2.5x step-up3, searcher keeps 60-70% of the residual after the pref4. Independent sponsor: 8% compounded pref, 100% catch-up to 20%, 80/20 split to 2.0x5. Common assumptions: $5.5M total LP cash, five-year hold, identical gross exit value across structures.

Figure data
Same exit, three different checks
Gross exit multipleSearch fund LP netSelf-funded search LP netIndependent sponsor LP net
1.5x1.50x1.50x1.47x
2.0x1.92x1.85x1.80x
3.0x2.75x2.20x2.56x
5.0x4.20x2.90x4.06x

Illustrative waterfall model; same gross exit across structures.

The model behind that figure uses published deal terms, not invented ones: a 1.5x step-up on search capital1, a searcher performance tranche that vests between a 20% and 35% net IRR2, an 8% to 15% preferred return with a 1.5x to 2.5x step-up for self-funded searchers3, and an 8% compounded preferred return with a full catch-up to a 20% promote for independent sponsors5. Every output is illustrative. It is not the terms of any SMBIN or third-party offering, and it is not a return forecast.

The four terms that decide your payout

Read a term sheet for the number that moves your money at a specific outcome range, not the number that sounds best in a pitch.

  • Step-up on search capital. A traditional search fund converts search capital into acquisition equity at roughly 150% of the original investment1. In self-funded search deals, a 2x step-up implies something close to a 50/50 debt-to-equity structure; some run 70% to 80% debt with only a 1.5x step-up instead6. The step-up alone tells you little without the capital structure behind it.
  • Preferred return and whether it compounds. Self-funded searchers commonly carry an 8% to 15% preferred return with a 1x liquidation preference3. A podcast guest on The SMB Investor described a similar range, 10% to 15%, with entrepreneurs keeping 60% to 70% of the residual after the pref4. The cited worked example assumes an 8% compounded pref with a full catch-up5.
  • The searcher's common equity and how it vests. Traditional search fund entrepreneurs typically vest into 25% to 30% of common equity across three equal tranches: one at acquisition, one on a four- to five-year time schedule, and one on performance, which starts vesting at a 20% net IRR to investors and is fully earned at 35%2. Solo searchers cap at 25%, pairs at 30%.
  • Promote tiers and the catch-up. Independent sponsor surveys report a 2% closing fee as the most common structure (67% of respondents) and a 5% of EBITDA management fee as the most common (76%), with 78% using a full catch-up and 60% obtaining a maximum carry of at least 25%7. These describe survey respondents, not the terms of this model or any offering. A separate survey of 300-plus deals found the most common closing fee band ran 2.00% to 2.49% of enterprise value, with 71% of deals using a variable-carry hurdle structure8.

Takeaway: each term moves money only at a specific outcome range. Know which range applies before you compare deals on the headline terms alone.

The traditional search fund, worked

Median capital raised per searcher rose to $500K for 2022 to 2023 launches, with a median of 12 investors per fund and a median raise time of three months9. Stanford calculates returns for original search investors on a cash-flow basis that includes losses from searches that never reached an acquisition, and excludes follow-on financing10.

Yale's illustrative model assumes a redeemable participating preferred security with no entrepreneur catch-up. In its base case ($10M enterprise value at 5x on $2M EBITDA, $5M debt, $500K search capital rolled in at a 1.5x step-up, five-year hold), the result is a 26% IRR and $2.61M to the searcher11. Move the entry multiple and the payout moves with it: $3.51M at a 4x entry, down to $1.89M at 6x and $1.36M at 7x12. Per the underlying Stanford data, 27 of 166 search fund companies, or 16%, delivered $10M or more to their entrepreneurs13.

Takeaway: search investors fund the search. If an acquisition closes, those investors receive the step-up when their search capital converts into acquisition securities1.

Self-funded search, worked

Community-reported terms for self-funded search equity run an 8% to 15% preferred return, a 1x liquidation preference, and a 1.5x to 2.5x step-up on search capital3. A guest on The SMB Investor podcast described a similar structure: a 10% to 15% pref, with entrepreneurs retaining 60% to 70% of what is left after the pref is paid4. One family office's own guide describes traditional search capital of $400K to $500K converting at 150% (for example, $450K becomes $675K of equity), and notes that self-funded searchers typically carry unlimited personal guarantees on their acquisition debt14.

Takeaway: this structure behaves like a preferred return with a kicker attached. In this illustrative model, it is relatively strong up to about 2x and pays the LP less than the other two structures at 5x and above.

Independent sponsor, worked

A worked example from a 2026 independent sponsor economics analysis: $10M of LP capital returning $25M over five years, with an 8% compounded pref, a 100% catch-up to a 20% promote, an 80/20 split to 2.0x, and 75/25 after. The LP receives $21.875M, a 2.19x multiple and roughly a 16.9% annualized return; the sponsor's carry is $3.125M5.

Takeaway: the closing fee and management fee get paid whether or not the deal works. The promote only shows up in the outcomes that clear the hurdle.

Where the structures converge and where they split

Who gets the profit as the outcome improves

Line chart of sponsor or searcher share of profit at gross exit multiples of 1.5x, 2x, 3x, 5x and 10x. Search fund rises from 0% to 24%. Self-funded search rises from 0% to 59%. Independent sponsor rises from 6% to 24%.
0%20%40%60%1.5x2x3x5x10x

━━ Search fund: 1.5x 0%, 2x 8%, 3x 13%, 5x 20%, 10x 24%

╌╌ Self-funded search: 1.5x 0%, 2x 15%, 3x 40%, 5x 53%, 10x 59%

┄┄ Independent sponsor: 1.5x 6%, 2x 20%, 3x 22%, 5x 23%, 10x 24%

In a self-funded deal the searcher's share of profit climbs past half as the outcome improves. In the other two structures it levels off near a quarter.

Source: Illustrative — same waterfall model as the exit-multiple figure above12345. Sponsor or searcher share of total profit, not the terms of any SMBIN or third-party offering.

Figure data
Who gets the profit as the outcome improves
Gross exit multipleSearch fund: sponsor share of profitSelf-funded search: sponsor share of profitIndependent sponsor: sponsor share of profit
1.5x0%0%6%
2x8%15%20%
3x13%40%22%
5x20%53%23%
10x24%59%24%

Illustrative waterfall model built from published deal terms.

Across all three structures, the sponsor or searcher's share of total profit starts near zero at modest outcomes and grows as the exit multiple rises. In the illustrative model, the self-funded structure is the outlier: its searcher's share keeps climbing past 50% of total profit, while the search fund and independent sponsor structures level off closer to a quarter. None of this is unique to one niche corner of the market. Excluding results of 10x or more, the aggregate outcome across Stanford's tracked search funds runs about 2.8x and 27% IRR15; of 337 search-acquired companies, including those still operating, 26.4% had a total or partial loss, 20.2% returned 1x to 2x, and only 8.3% returned 10x or more16. About 58% of concluded search funds acquired a company at all, falling to roughly 48% for funds launched between 2021 and 202417, and a typical unit of search fund capital costs $35K to $50K18.

Takeaway: terms matter most at the higher exit multiples in this illustrative model. The study's outcome bands do not show how many deals fall below the range where these structures diverge16.

How this breaks

  • The preferred return accrues on paper, raising the investor's distribution priority at a later, smaller exit35.
  • The performance tranche resets the searcher's incentives toward a quick sale once the IRR hurdle is in sight, rather than toward the business's long-run health.
  • A hold period stretches past the five years these models assume, and the IRR hurdle that looked reachable at close becomes mathematically out of range.
  • Fees get paid on a deal that later loses money. A 2% closing fee and a 5% of EBITDA management fee can create that risk under terms that make them payable before exit7.
  • A "2x step-up" gets quoted on its own, without the debt-to-equity structure it implies, which can hide a much higher-risk capital stack6.

Takeaway: what does an illustrative waterfall show at 0.5x, 1x and 2x beside the sponsor's target multiple? Most of the real questions get answered well below the headline case.

What I'd check

I build software, so the first thing I did with these terms was put them in a model. Here is what I'd check before a first commitment, not what I'd recommend anyone do:

  1. What does the waterfall itself show in a spreadsheet beyond the projected IRR?
  2. What does the illustrative model show at 0.5x, 1x, 2x and the manager's stated target? Most of the money questions are answered by 2x.
  3. Find the three numbers that move the payout: the pref rate and whether it compounds, the step-up, and where the promote tiers start.
  4. Add up the fees that get paid regardless of outcome: closing fee, management fee, any salary.
  5. Check the hold-period assumption. A pref that accrues for seven years instead of five is a different deal than the one in the pitch.
  6. Only then compare the manager's stated target to what the research says about how outcomes actually spread16, and read the population and period notes in how search fund studies compare before treating any one figure as a base rate.

What I still don't know: how often real deals deviate from these "typical" terms. The surveys behind the self-funded numbers are self-reported community posts and a single podcast guest, and independent sponsor figures arrive through a vendor's recap of a 2026 survey rather than the primary report itself.

For a broader map of how search fund terms compare with other private equity structures, see search fund vs. traditional PE. For the fee language a term sheet actually uses, see SMB private equity fee structures. For how often a search fund reaches an acquisition at all, before any of this waterfall applies, see broken searches and acquisition risk.

Sources

-1 Stanford GSB, 2024 Search Fund Study, Appendix A, Stage One, pp. 23-24. -9 Stanford 2024 Study, p. 5 and Exhibit 3. -10 Stanford 2024 Study, "Financial Return Method" and Appendix B. -19 Stanford 2024 Study, pp. 9-10, Figures I and J. -20 Stanford 2024 Study, p. 10. -2 Goel, Wyma, Wexler, O'Connor, Wasserstein, "Exploring Search Fund Entrepreneur Economics", Yale SOM case (Jul 23, 2023), pp. 1-2, Figure 2. -11 Same Yale case, pp. 7-8. -12 Same Yale case, p. 8. -13 Same Yale case, p. 1, citing the 2022 Stanford study. -14 LS&C, "Search Fund vs Self-Funded Search" (Sep 9, 2026). -7 Citrin Cooperman 2026 independent sponsor survey via CapitalPad (Sep 21 and Sep 24, 2026). -8 McGuireWoods 2024 Independent Sponsor Deal Survey via CapitalPad. -5 CapitalPad, "Independent Sponsor Economics" (Sep 24, 2026). -3 Searchfunder, "Standard Investor Terms". -4 The SMB Investor podcast, Ep. 1. -6 Search fund step-up and capital structure discussion. -16,15,17,18 Stanford GSB 2026 Search Fund Study, via CapitalPad (16), the ClearlyAcquired recap (15,17), and the Stanford primer (18). Study figures for the asset class, not the performance of any fund, network or firm.

Sources

  1. Stanford GSB, 2024 Search Fund Study, Appendix A, Stage One (pp. 23-24; PDF opened) ↑
  2. Goel, Wyma, Wexler, O'Connor, Wasserstein, "Exploring Search Fund Entrepreneur Economics", Yale SOM case (Jul 23, 2023), pp. 1-2, Figure 2 (PDF opened) ↑
  3. Searchfunder community post "Standard investor terms for US self-funded search" ↑
  4. The SMB Investor podcast, Ep 1. Self Funded Search, Jason Ehrlich, 00:30:29 ↑
  5. CapitalPad, "Independent Sponsor Economics: Fees, Promote & Waterfall" (Sep 24, 2026) ↑
  6. The SMB Investor podcast, Ep 1. Investing & Building a Portfolio of SMBs, Grant Hensel, 00:20:32 ↑
  7. Citrin Cooperman 2026 Independent Sponsor survey, via CapitalPad statistics and economics pages (Sep 21 and 24, 2026) ↑
  8. McGuireWoods 2024 Independent Sponsor Deal Survey, via CapitalPad (Sep 2026) ↑
  9. Stanford GSB, 2024 Search Fund Study, p. 5 and Exhibit 3 (PDF opened) ↑
  10. Stanford GSB, 2024 Search Fund Study, Financial Return Method and Appendix B (PDF opened) ↑
  11. Yale SOM case, Exploring Search Fund Entrepreneur Economics (Jul 23, 2023), pp. 7-8 (PDF opened) ↑
  12. Yale SOM case, Exploring Search Fund Entrepreneur Economics (Jul 23, 2023), p. 8 (PDF opened) ↑
  13. Yale SOM case, Exploring Search Fund Entrepreneur Economics (Jul 23, 2023), p. 1, citing Stanford GSB 2022 Search Fund Study ↑
  14. LS&C, "Search Fund vs Self-Funded Search: What Each Pays" (Sep 9, 2026) ↑
  15. Stanford GSB 2026 Search Fund Study, via ClearlyAcquired recap ↑
  16. Stanford GSB 2026 Search Fund Study, via CapitalPad statistics page (updated Sep 14, 2026) ↑
  17. Stanford GSB 2026 Search Fund Study, via ClearlyAcquired recap ↑
  18. Stanford GSB Search Fund Primer (2026 edition, PDF opened) ↑
  19. Stanford GSB, 2024 Search Fund Study, pp. 9-10, Figures I and J (PDF opened) ↑
  20. Stanford GSB, 2024 Search Fund Study, p. 10 (PDF opened) ↑