What SBA Loan Charge-Off Data Shows About SMB Acquisitions

By , Co-Founder and CTO, SMB Investor Network

7 min read

Among SBA acquisition loans that were charged off, the median loss was 76 percent of the original amount1. Loan charge-offs can signal equity impairment, but these files do not measure the equity loss rate12. The same data also shows acquisition loans charge off less often than other 7(a) loans. Read separately, either fact tells a partial story. Read together, they say what a loan loss actually implies for the equity sitting behind it.

This is a full pass over SBA's public 7(a) loan-level FOIA files, 50,942 change-of-ownership approvals from FY2018 through June 30, 20263, not a vendor's recap of them. Loan performance is not equity performance, and that gap is the point of this post, not a footnote to it.

Three honest numbers from one dataset

Change-of-ownership 7(a) loans charge off less often than the rest of the 7(a) book. By count, 3.2% of change-of-ownership loans approved FY2018 to FY2021 had charged off, versus 4.9% for other existing-business loans and 5.6% for startup and new-business loans4. By dollars, acquisition loans have a higher charge-off rate than existing-business loans: 1.53% for change of ownership versus 1.27% for existing businesses and 1.84% for startups4.

That comparison flatters acquisition lending relative to starting a business from scratch. It says nothing about whether 3.2%4 is a small number or a large one for the equity behind those loans, and it says nothing about how old the loans in that comparison are.

Why young loans look safer than they are

Cumulative to June 30, 2026, 5.2% of the FY2018 change-of-ownership cohort had been charged off, 4.1% of FY2019, and 2.5% of FY20205. Read across those three years and the rate keeps falling as the cohort gets younger, which looks reassuring right up until you notice why: a charged-off change-of-ownership loan reaches charge-off a median of about 50 months after approval, with the middle half landing between 38 and 66 months6. Within the first 48 months, only 1.75% of the FY2018 cohort and 1.0% of the FY2022 cohort had charged off6. A loan that is two years old has not lived through the years where these failures concentrate. Its low rate is not yet a result. It is a rate measured before the risk arrives.

Young loans look safer because the risk has not arrived yet

Slider selects an approval cohort year, 2018 to 2020. Cumulative charge-off to date is 5.2% for the 2018 cohort, 4.1% for 2019 and 2.5% for 2020. A fixed panel notes that charged-off loans reach charge-off a median of about 50 months after approval, and that within the first 48 months only 1.75% of the 2018 cohort and 1.0% of the 2022 cohort had charged off.

FY2020 cohort (about 6 years old): cumulative charge-off to date 2.5% of loans, 1.1% of dollars

FY2018FY2019FY2020

Charged-off loans reach charge-off a median of about 50 months after approval (middle half: 38 to 66 months). Within the first 48 months, only 1.75% of the FY2018 cohort and 1% of the FY2022 cohort had charged off.

A loan two years old has not lived through the years where charge-offs concentrate. Its low rate is not yet a result.

A default rate measured on young loans is a rate measured before the risk arrives. Ask how old the loans are before you use any figure.

Source: Modern Acquisition analysis of SBA 7(a) FOIA data, as of June 30, 2026. Cumulative charge-off to date by approval cohort5. Timing to charge-off6.

Figure data
Young loans look safer because the risk has not arrived yet
Approval cohortCharged off, share of loansCharged off, share of dollars
FY20185.2%2.6%
FY20194.1%2%
FY20202.5%1.1%
Median time to charge-off50 monthsmiddle half 38–66 months
FY2018, within 48 months1.8%—
FY2022, within 48 months1%—

Cumulative charge-offs to June 30, 2026, SBA 7(a) change-of-ownership loans.

The figure counts charge-offs, not defaults. A charge-off comes at the end, a median of about 50 months after approval6, and a loan may already be in default before one is recorded.

Takeaway: a change-of-ownership loan approved in the last two years cannot yet tell you whether it will fail. Everything financed since 2023 is still too young to judge.

Which loans fail, and what is left when they do

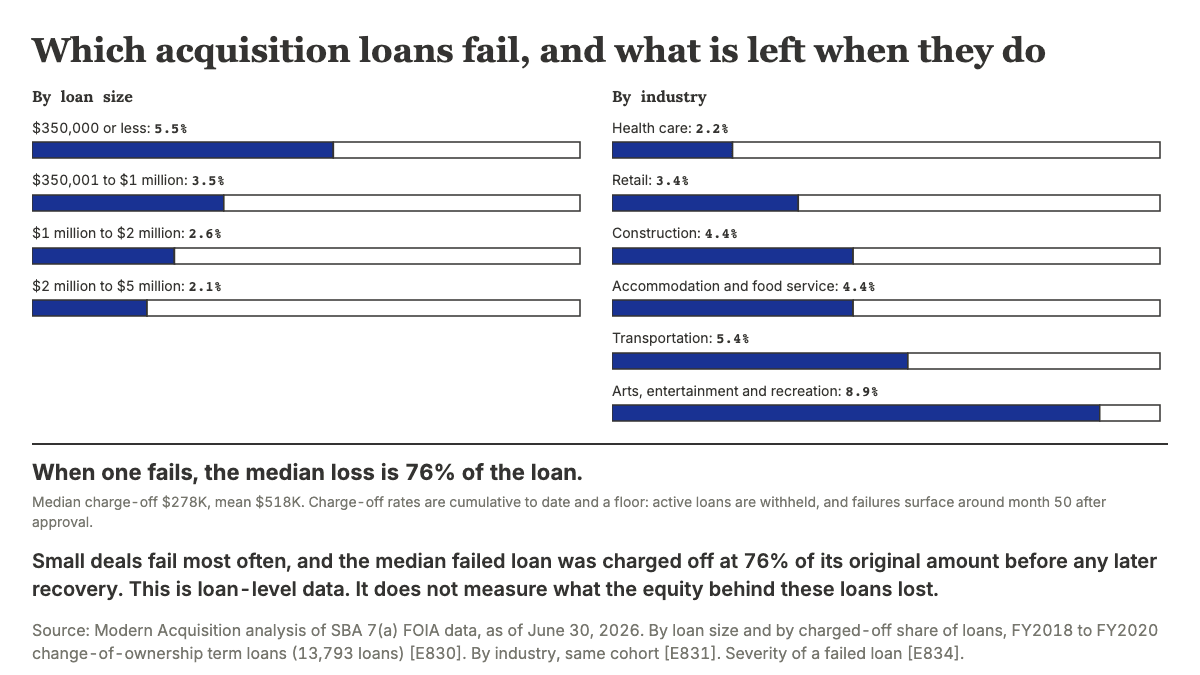
The averages hide a wide spread. By loan size, charge-off rates for change-of-ownership term loans approved FY2018 to FY2020 ran from 5.5% for loans of $350,000 or less down to 2.1% for loans of $2 million to $5 million7. By industry, the same cohort ran from 2.2% in health care up to 8.9% in arts, entertainment and recreation, with restaurants, landscaping and other Main Street categories clustered in the middle8.

Which acquisition loans fail, and what is left when they do

Two bar panels. By loan size, charge-off rate is 5.5% at or under $350,000, 3.5% from $350,001 to $1 million, 2.6% from $1 million to $2 million, and 2.1% from $2 million to $5 million. By industry, charge-off rate ranges from 2.2% in health care to 8.9% in arts, entertainment and recreation. A footer states the median failed loan lost 76% of its original amount.

By loan size

$350,000 or less: 5.5%

$350,001 to $1 million: 3.5%

$1 million to $2 million: 2.6%

$2 million to $5 million: 2.1%

By industry

Health care: 2.2%

Retail: 3.4%

Construction: 4.4%

Accommodation and food service: 4.4%

Transportation: 5.4%

Arts, entertainment and recreation: 8.9%

When one fails, the median loss is 76% of the loan.

Median charge-off $278K, mean $518K. Charge-off rates are cumulative to date and a floor: active loans are withheld, and failures surface around month 50 after approval.

Small deals fail most often, and the median failed loan was charged off at 76% of its original amount before any later recovery. This is loan-level data. It does not measure what the equity behind these loans lost.

Source: Modern Acquisition analysis of SBA 7(a) FOIA data, as of June 30, 2026. By loan size and by charged-off share of loans, FY2018 to FY2020 change-of-ownership term loans (13,793 loans)7. By industry, same cohort8. Severity of a failed loan1.

Figure data
Which acquisition loans fail, and what is left when they do
GroupCharged off, share of loans
Loan size: $350,000 or less5.5%
Loan size: $350,001 to $1 million3.5%
Loan size: $1 million to $2 million2.6%
Loan size: $2 million to $5 million2.1%
Industry: Health care2.2%
Industry: Retail3.4%
Industry: Construction4.4%
Industry: Accommodation and food service4.4%
Industry: Transportation5.4%
Industry: Arts, entertainment and recreation8.9%
Median loss on a failed loan, share of original amount76%
Median loss on a failed loan$278,000
Mean loss on a failed loan$518,000

Here "fail" means the loan was charged off; the file does not record whether the business itself failed. The smallest loans in these cohorts had the highest observed charge-off rate7, and when a change-of-ownership loan does fail, it fails close to completely. The median charged-off loan lost 76% of its original approved amount, with a median charge-off of $278,000 and a mean of $518,0001. Across the full FY2018 to FY2026 window, 723 change-of-ownership term loans have charged off for a combined $374.3 million9.

Takeaway: the smallest loans in these cohorts had the highest observed charge-off rate7. And a failure, when it happens, is close to a total loss on that loan.

What a loan charge-off means for the equity

A charge-off is a gross loan charge-off that includes guaranteed and unguaranteed portions, recorded before possible later recoveries. A loan charge-off can signal equity impairment, but the SBA file does not measure equity outcomes12. The equity loss rate for these loans remains unknown.

Under SBA SOP 50 10 8, a complete change of ownership requires a minimum equity injection of at least 10% of total project costs10. A seller note only counts toward that injection if it sits on full standby for the life of the SBA loan, and even then for no more than half the required amount11. That equity sits behind the bank in the capital stack and absorbs the first losses when a deal goes wrong, well before the loan itself shows any distress.

This is consistent with what the equity side of the search fund market already shows on its own terms. Of 337 search-acquired companies, including those still operating, 26.4% had a total or partial loss for their investors2, a rate far higher than any of the loan-level charge-off numbers above. The two datasets are not measuring the same thing: one is gross loan charge-off, the other is LP loss on the equity. Reading only the loan number and concluding the deal was safe skips the layer that actually held the risk. For more on how often a search specifically fails to reach an acquisition at all, before any of this applies, see broken searches and acquisition risk; for how the outcomes that do close are distributed, see search fund return dispersion.

Takeaway: a loan charge-off can signal equity impairment, but the equity outcomes for these loans are unknown12. Never read it as a probability that your own capital is safe.

How this number breaks

  • Counting only young loans. A cohort under two years old has not reached the months where charge-offs concentrate, so its low rate is an artifact of age, not safety56.
  • Counting only resolved loans. Excluding loans that are still open pushes the rate up, because the denominator shrinks to loans that have already reached an endpoint.
  • Mixing count-weighted and dollar-weighted rates. A portfolio can look better by count and worse by dollars, or the reverse, depending on which failures are large4.
  • Treating a loan payoff as an equity win. A refinance or a distressed sale below the purchase price can pay off the SBA loan in full, with no charge-off recorded and no signal that the equity holder came out ahead.
  • Ignoring how many approvals never fund at all. Between 7.3% and 10.9% of change-of-ownership approvals in each year from FY2018 to FY2025 were later cancelled without funding12, which changes any rate built on approvals rather than funded loans.

Takeaway: every figure in this post is one of the above unless stated otherwise. Ask which loans, how old, and whether it counts loans that are still open before using any acquisition "failure rate" you read elsewhere.

What I'd check

I built the underlying pull from SBA's own loan files because a single vendor recap did not answer these questions on its own. Here is what I'd check before treating a lender's or a manager's loss figure as an answer:

  1. Ask which loans are counted: change of ownership specifically, or acquisitions blended with startups and expansions.
  2. Ask how old the cohort is. The risk in this data concentrates around month 506.
  3. Ask whether the rate includes loans that are still open, or only loans that have already resolved.
  4. Loan loss rates and equity loss rates measure different outcomes12. Equity sits behind the bank's debt claim.
  5. Check the loan size and industry against these ranges before assuming a "typical" deal behaves like the program average.
  6. Read the search fund study comparability checklist before comparing any two loss figures from different sources, since population and observation period drive most of the apparent disagreement between them.

What I still don't know: how often a paid-off loan quietly hides an equity loss, since a sale at a discount can still satisfy the bank in full. SBA's loan file cannot answer that question on its own.

Sources

-5 SBA 7(a) FOIA loan-level data, change-of-ownership term loans, cumulative to June 30, 2026. -7 SBA 7(a) FOIA data, FY2018-FY2020 change-of-ownership term loans by loan size. -8 SBA 7(a) FOIA data, FY2018-FY2020 change-of-ownership term loans by industry and business type. -4 SBA 7(a) FOIA data, FY2018-FY2021 term loans, change of ownership versus other business ages. -6 SBA 7(a) FOIA data, timing from approval to charge-off. -1 SBA 7(a) FOIA data, severity of charged-off change-of-ownership loans. -12 SBA 7(a) FOIA data, cancellation rates by approval year. -9 SBA 7(a) FOIA data, cumulative charge-off count and dollars, FY2018-FY2026 cohorts. -11 Starfield & Smith, equity injection requirements under SOP 50 10 8 (May 6, 2025). -2 Stanford GSB 2026 Search Fund Study, via CapitalPad. Study figures for the asset class, not the performance of any fund, network or firm.

Method: change-of-ownership loans are identified from SBA's BusinessAge field, not coded before FY2018. Approval counts include loans later cancelled; sizes, sectors and loss rates use funded term loans only, excluding cancelled and undisbursed loans. Charge-off rates are cumulative to June 30, 2026 and are a floor: active loans are included in the denominator, but their future charge-offs are not yet observable, and the timing data above shows why a young cohort understates its own eventual rate.

Sources

  1. Modern Acquisition analysis of SBA 7(a) FOIA data as of 2026-06-30 ↑
  2. Stanford GSB 2026 Search Fund Study, via CapitalPad statistics page (updated Sep 14, 2026) ↑
  3. SBA Open Data, 7(a) & 504 FOIA dataset (FOIA_7a_FY2010_FY2019 and FOIA_7a_FY2020_Present, asof 260630); Modern Acquisition analysis ↑
  4. Modern Acquisition analysis of SBA 7(a) FOIA data as of 2026-06-30 ↑
  5. Modern Acquisition analysis of SBA 7(a) FOIA data as of 2026-06-30 (term loans, excl. cancelled/undisbursed) ↑
  6. Modern Acquisition analysis of SBA 7(a) FOIA data as of 2026-06-30 ↑
  7. Modern Acquisition analysis of SBA 7(a) FOIA data as of 2026-06-30 ↑
  8. Modern Acquisition analysis of SBA 7(a) FOIA data as of 2026-06-30 ↑
  9. Modern Acquisition analysis of SBA 7(a) FOIA data as of 2026-06-30 ↑
  10. SBA SOP 50 10 8 technical updates effective 6.1.2025, equity injection section ↑
  11. Starfield & Smith, Best Practices: A Review of Equity Injection Requirements Under SOP 50 10 8 (May 6, 2025) ↑
  12. Modern Acquisition analysis of SBA 7(a) FOIA data as of 2026-06-30 ↑