SMB Purchase Multiples 2015–2025: A Decade of Data
by Sean Smith, Managing Partner of Search Fund Ventures
TL;DR
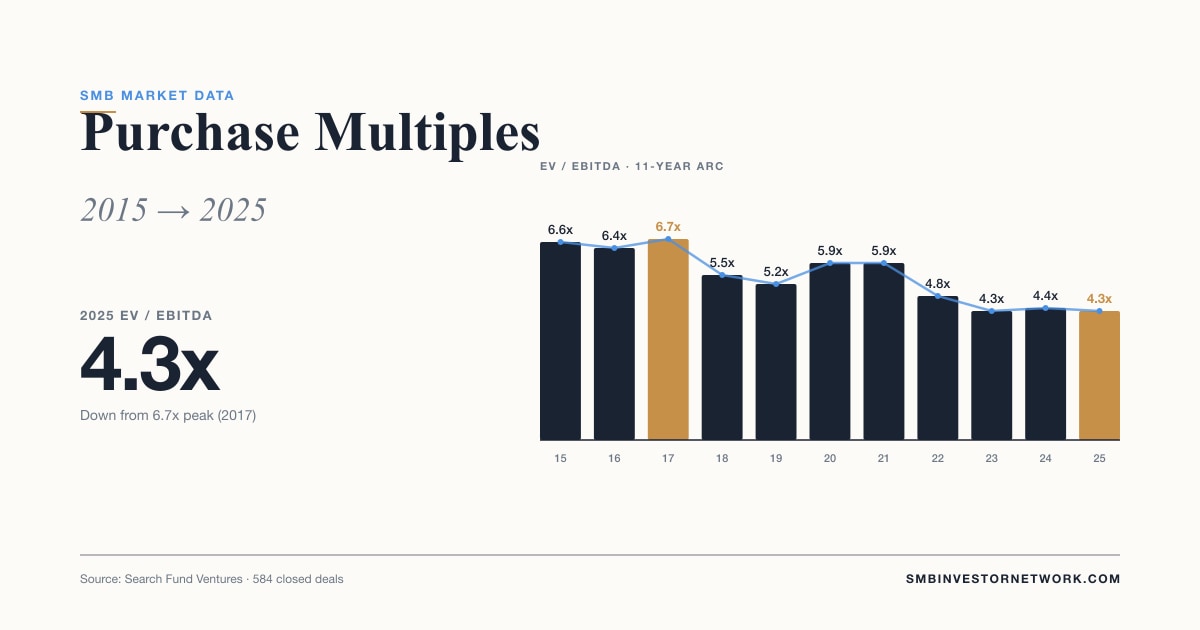
Average SMB acquisition multiples fell to 4.3x EBITDA in 2025, down from a 6.7x peak in 2017. What 10 years of data tells us about the lower middle market.
By Sean Smith, Managing Partner, Search Fund Ventures
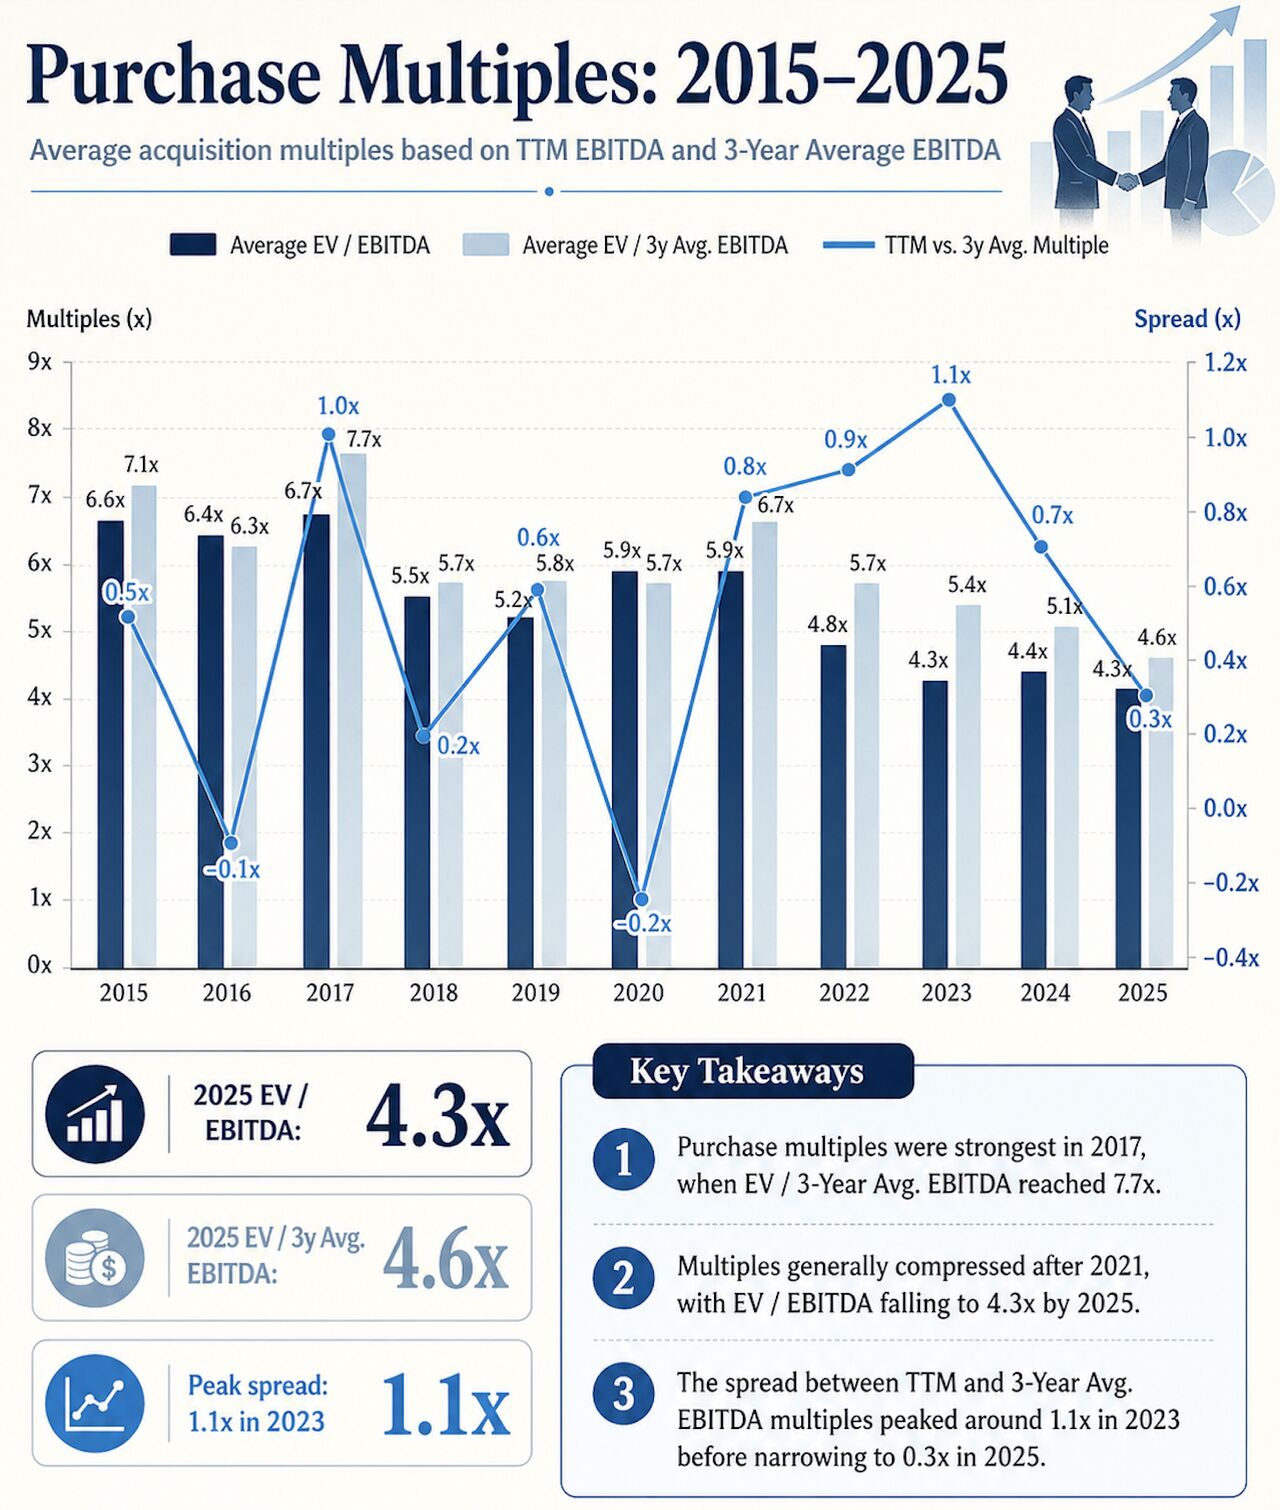
TL;DR — A decade of SMB acquisition data shows average purchase multiples fell to 4.3x EBITDA in 2025, down from a 6.7x peak in 2017. The TTM-vs-3-year-average spread has compressed to 0.3x, signaling buyers are no longer paying up for short-term performance bumps. Despite growing interest in small business acquisitions, the data does not point to a peak — it points to a buyer's market.
What the Data Shows
We spend a lot of time at Search Fund Ventures thinking about where the SMB M&A market is today. The past decade of purchase multiples tells an interesting story:
- 2017 was the peak. Average EV / EBITDA hit 6.7x, with the EV / 3-Year Average EBITDA reaching 7.7x — the strongest year for sellers in the dataset.
- Multiples have compressed meaningfully post-2021. From a near-term high of 5.9x in 2021, average multiples have fallen each year, landing at 4.3x in 2025.
- The TTM vs. 3-Year spread peaked at 1.1x in 2023. That gap signaled buyers were paying up for recent performance and businesses had experienced rapid growth in the trailing 3-year period — likely a reflection of the post-COVID demand surge across many essential service categories.
- That spread has narrowed to 0.3x in 2025. Earnings have stabilized, and buyers are no longer underwriting growth-rate optimism into entry pricing.
It's worth noting the dataset includes businesses doing $500K–$5M in EBITDA, with roughly 50% below $1M and the remainder above. This is the heart of the lower middle market — the segment most relevant to self-funded search investors, independent sponsors, and small-cap private equity firms. For the most recent quarter-by-quarter breakdown, see our 5 takeaways from SFV's Q2 2025 Closed Deals Report.
Why Multiples Compressed (And Why It Matters)
The compression from 6.7x to 4.3x is not random. Several structural forces are converging:
Cost of capital normalized. The 2015–2021 era of cheap debt inflated multiples across every asset class, and SMB was no exception. As rates rose, leveraged buyers had to underwrite more conservatively. Less debt capacity at the same equity check translates directly into lower entry prices.
Demographic supply is overwhelming buyer demand. As we wrote in The Silver Tsunami, more than 10 million baby boomer-owned businesses are heading toward transition, and the buyer pool has not grown proportionally. When supply outpaces demand, multiples compress. This is what we are seeing in the data.
Sellers are recalibrating expectations. The TTM vs. 3-year-average spread tells the clearest story here. In 2023, buyers paid 1.1x more for recent earnings than for the smoother 3-year picture — meaning sellers were getting credit for the COVID-era bounce. By 2025, that premium has all but disappeared. Buyers are paying for normalized earnings, not for last year's print.
Quality dispersion is widening. As more businesses come to market, the gap between A-tier and B-tier assets has widened. Top-quartile businesses with recurring revenue and clean financials still trade at premium multiples. Average and below-average businesses are increasingly stuck — and that's pulling the average down.
About the Author

Sean Smith
Managing Partner of Search Fund Ventures
Sean brings extensive experience in search funds and SMB acquisitions. He's built and scaled multiple businesses and now focuses on connecting investors with high-quality deal flow.
Connect on LinkedInWhat This Means for Buyers and Searchers
For acquisition entrepreneurs and independent sponsors, a 4.3x average is not a crisis — it's a setup. Here's what we'd flag:
- Sub-5x deals are now the rule, not the exception. That said, getting below the average still requires sourcing discipline. Broad auctions still clear at or above the mean. As we covered in why proprietary sourcing matters, the under-marketed deals are where the math gets attractive.
- Entry valuation is one of the few control points buyers actually have. Unlike post-close operating performance — which depends on a hundred variables — entry multiple is locked in at signing. Disciplined buyers should be using this market to pay rational prices, not to chase lower-quality businesses at the same old multiples.
- Seller financing is more available than at any point in the last decade. Motivated boomer sellers without a viable succession plan are increasingly willing to carry 10–30% of purchase price as seller notes, which improves leverage and signals seller confidence.
Download the SMB Investing Guide
Get our free playbook on search fund investing fundamentals, due diligence checklists, and portfolio construction strategies.
What This Means for LP Investors
For LPs allocating to SMB private equity, search funds, and independent sponsor deals, the multiple compression is a tailwind for vintage 2025 returns — but only if the manager is sourcing well and underwriting conservatively.
A few things we'd watch for in evaluating fund managers right now:
- Average entry multiples on recent vintages. A manager whose 2024–2025 deals average 5x+ in this market may be missing out on the compression — or paying up for "premium" assets that don't justify it.
- Sourcing breakdown. What percentage of deals came from broad auctions vs. proprietary outreach vs. network referrals? Proprietary sourcing during a buyer's market is when the magic happens.
- Underwriting assumptions. Are managers underwriting a return of multiple expansion at exit (dangerous) or assuming flat multiples and modeling returns from operational improvements (more defensible)?
For a deeper framework on how multiples interact with SMB private equity fee structures and net returns to LPs, see our standalone analysis. The short version: in a compressed-multiple environment, fee drag matters more, not less.
The Bottom Line
Despite the fervor and growing interest in small business acquisitions, the data does not point to a peak in multiples. It points to compression — driven by demographic supply, normalized cost of capital, and a buyer base that is finally pricing in normalized earnings instead of recent peaks.
For the right buyer with the right sourcing engine, this is the most attractive entry environment in a decade.
If you want to learn more about how self-funded search investors are taking advantage of this dynamic, download our guide to self-funded search investing. And for ongoing deal flow and analysis, join the SMB Investor Network.
Want the complete picture?
This article is part of a comprehensive guide. Get the full report with data, frameworks, and actionable insights.
Related Reading
How to Evaluate an SMB Fund: A Framework for LP Investors
A practical framework for evaluating SMB fund opportunities, covering operator assessment, deal economics, portfolio strategy, and governance — with benchmarks from real market data.
The Silver Tsunami: Why 2026 Is the Best Time to Invest in Small Businesses
10M+ baby boomer business owners are retiring, creating unprecedented deal flow. Here's why smart investors are positioning now for the SMB acquisition wave.
SMB Private Equity Fee Structures Explained: What LPs Should Know
A clear breakdown of fee structures in SMB private equity — management fees, carried interest, transaction fees, and how they differ between self-funded search and independent sponsor deals.
Ready to get started?
Create your Investor Profile and start accessing exclusive deals and resources.