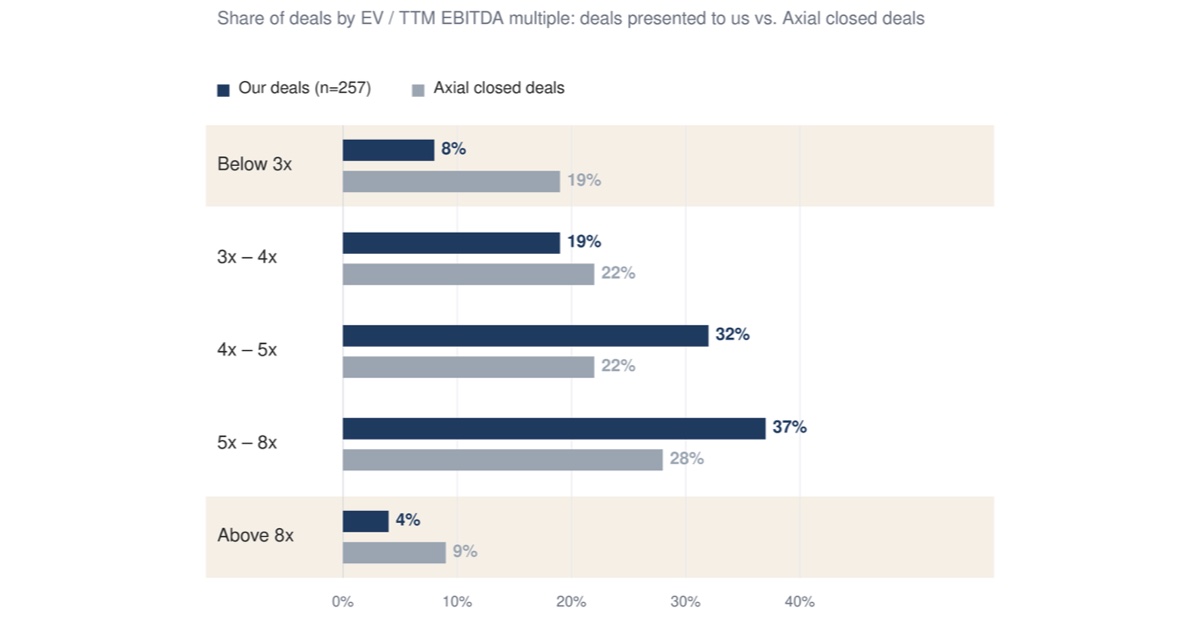
Every so often we compare the prices on deals that reach us with what lower middle market deals actually close at. Axial published closed-deal valuation data in September covering Q3 2024 through Q3 2026, so we lined up our own deal flow over the same window.
Our sample is 272 North American deals presented to us since July 2024 with both a price at LOI and TTM EBITDA. Most came from independent sponsors and self-funded searchers raising equity for a deal they already had under LOI. The average company has ~$2.7mm of EBITDA and a ~$12.1mm EV. Axial's average closed deal has ~$2.3mm of EBITDA and an ~$11mm EV. Roughly the same companies, seen at two points in the process: ours at LOI, Axial's at close.
The headline numbers are close. Our median price at LOI is ~4.6x TTM EBITDA against Axial's closed median of 4.3x, and the averages are nearly identical (4.9x vs. 4.8x). The more useful finding is where the two distributions differ, which is almost entirely in the tails.
What Axial's closed-deal data shows
- Wide, but centered. The median is 4.3x and the middle 50% runs from 3.2x to 5.7x. About 44% of deals closed between 3x and 5x, 28% between 5x and 8x, 9% above 8x and roughly one in five below 3x.
- Size changes the range more than the median. Medians across Axial's five EBITDA bands sit between 3.9x and 4.7x. A third of sub-$1mm EBITDA deals closed below 3x, against 5% of $5mm+ deals.
- Buyer type and sector move the number. PE funds paid a 5.1x median, independent sponsors 4.4x, holding companies and strategics 4.3x and family offices 3.6x. Technology and software (5.8x) and healthcare (5.7x) sit about two turns above construction and trade services (3.8x).
- Consideration at close only. Earnouts and other contingent consideration are excluded.
Where our LOIs and Axial's closings part ways
- The cheap tail. Our lower quartile is ~3.8x against Axial's 3.2x. Only ~8% of our LOIs were priced below 3x, while about 19% of Axial deals closed there. Very few sponsors sign an LOI that low. Most sub-3x outcomes are found later, in diligence and the re-trade.
- The rich tail. Our upper quartile (~5.6x) is almost identical to Axial's (5.7x), but only ~4% of our LOIs were priced above 8x, against 9% of Axial closings. The pattern holds by sector: 29% of the healthcare deals we saw were priced above 6x, against 40% of Axial's healthcare closings, and even in the trades it is 6% vs. 12%. The highest-multiple deals often go to PE funds and strategics with committed capital, which don't need to raise outside equity, so fewer of them reach us.
- Small deals. Below $1mm of EBITDA, our median LOI is ~4.5x (n=69) against Axial's 3.9x closed median. 13% of our small deals were priced below 3x, against 33% that closed there. Above $5mm, our median is ~4.3x (n=28), close to Axial's 4.4x.
- Buyer type. Independent-sponsor deals in our flow carry a ~4.8x median at LOI (n=112) against Axial's 4.4x closed median for independent sponsors. Self-funded searcher deals sit at ~4.4x (n=120).
Taken together, our LOI prices are compressed at both ends. Roughly 80% of them sit between ~3x and ~7x, while Axial's closings run from ~2.4x to ~8x.
| EV / TTM EBITDA | Our LOI prices (n=272) | Axial closed deals |
|---|
| Below 3x | 8% | 19% |
| 3x – 4x | 19% | 22% |
| 4x – 5x | 32% | 22% |
| 5x – 8x | 37% | 28% |
| Above 8x | 4% | 9% |
The gap moves with the market
Lining up the periods:
- 2H24: ~4.4x at LOI vs. 4.1x at close
- 1H25: ~4.8x vs. 3.8x, a full turn apart
- 2H25: ~4.7x vs. 4.6x
- 1H26: ~4.5x vs. 4.4x
- 2H26 to date: ~4.7x (n=14) vs. a partial Q3 reading of 3.5x that Axial itself treats as incomplete
Some of the 1H25 gap is mix, since Axial notes that period had more small businesses in its data. But in our experience, LOI prices are sticky and lag the closing market by a few months. When buyers get more cautious, the difference shows up in diligence and in deals that don't close. Axial's mid-year survey of 79 dealmakers fits that pattern: 57% cited valuation expectations as the biggest reason deals failed to close in 1H 2026, up from 28% in 2025.
A worked example
Take a $0.8mm EBITDA trades business under LOI at 4.5x, the median for that size band in our flow, or ~$3.6mm. At Axial's closed median for the same band (3.9x) it is ~$3.1mm, and a quarter of comparable deals closed at or below ~2.6x (~$2.1mm). The ~$0.5mm between the LOI and the closed median is about 13% of the price, roughly the size of a typical seller note in our deal flow (~15% of price).
We would rather anchor the fixed price near where comparable deals close and pay any difference through consideration tied to the earnings the seller is claiming, whether that is an earnout or a seller note with performance terms.
What we take from this
- Anchor to closings, not LOIs. In this size band, ~4.3x is the closed median and 3.2x–5.7x is the middle range. A price above ~6x needs a specific, written reason: contracted recurring revenue, backlog or add-on math.
- Expect diligence to move price most below $1mm EBITDA. A third of those deals close under 3x, while only about one in eight is signed there.
- Don't count on multiple arbitrage inside the lower middle market. Medians are flat from sub-$1mm to $5mm+ in both datasets. The step-up comes above ~$10mm of EV, where GF Data puts deals at ~6.8x, so plan on growing EBITDA rather than on multiple expansion.
- Watch the gap. It reached a full turn in 1H25. When it widens, structure does more work than headline price.
- For LPs, benchmark the entry against its peers. Independent sponsors close at ~4.4x and PE funds at ~5.1x. A sponsor paying well above that should be able to explain exactly what it is buying.
A note on method: our figures are prices at LOI on deals presented to us, not closings. Where a deal includes an earnout, our figure includes it and Axial's excludes it. Read the comparison as directional.
We'll keep updating these comparisons. If you want our deal sheet and future benchmark notes, you can join SMB Investor Network at smbinvestornetwork.com. If you'd like to walk through how we would price a specific deal, book time with me.
Sources
- Axial, What Are Businesses Selling For? Valuation Multiples by Company Size, Sector & Buyer Type (closed deals, Q3 2024 – Q3 2026 to date), Sep 8, 2026: https://www.axial.net/forum/valuation-multiples/
- Axial, Lower Middle Market 2H Outlook: Valuations, Deal Activity & Market Trends (Part 1), Aug 11, 2026: https://www.axial.net/?p=71667
- Mercer Capital, Transactions Q3 2026 (GF Data multiples by size), Fall 2026: https://mercercapital.com/media/g5wbcln5/mercer-capital_transactions-q3-2026.pdf
- SFV deal data (Deal OS CRM): North American deals presented to SFV under LOI with Source Date from Jul 1, 2024 to Oct 19, 2026 and both price and TTM EBITDA (n=272). Excludes TTM EBITDA under $0.1mm and multiples outside 0.5x–25x; non-USD figures converted to USD. Sub-sample n noted for each cut.