Q2 2025 Closed Deals: 5 Takeaways from 584 SMB Acquisitions
by Sean Smith, Managing Partner of Search Fund Ventures
TL;DR
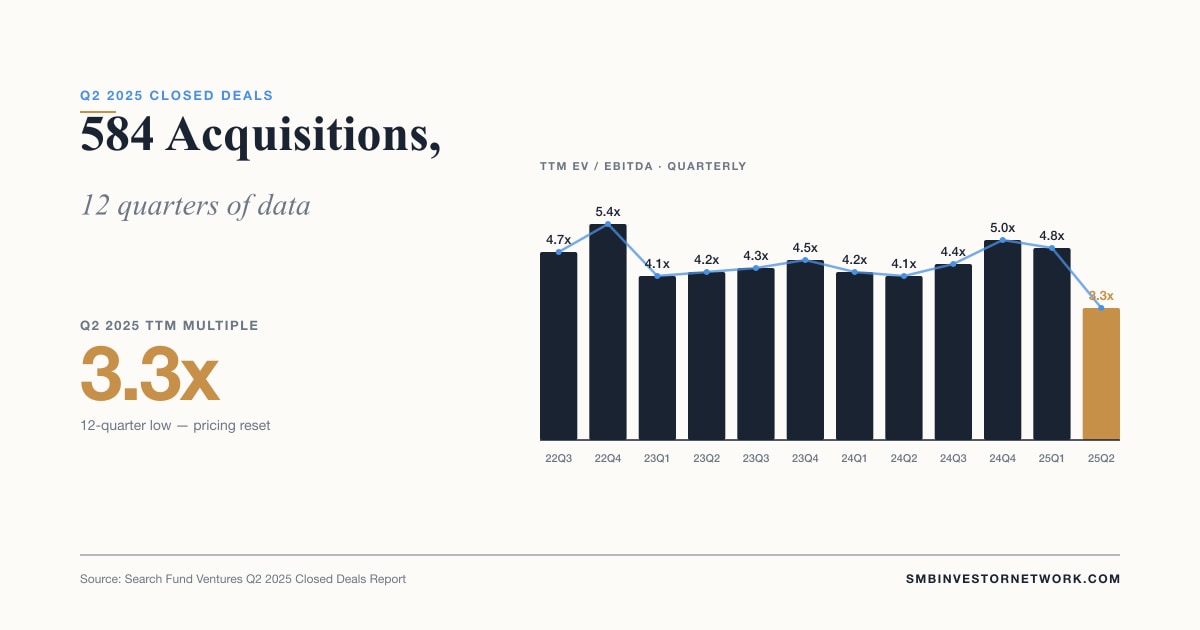
TTM multiples slid to 3.3x in Q2 2025 — a 12-quarter low. Five takeaways from Search Fund Ventures' analysis of 584 SMB closed deals.
By Sean Smith, Managing Partner, Search Fund Ventures
TL;DR — We just finished digging into Search Fund Ventures' Closed Deals Report for Q2 2025, focusing on US business acquisitions between $500K and $5M EBITDA. Across 584 deals over 12 quarters, the data shows a meaningful pricing reset: average TTM multiples slid to 3.3x — a 12-quarter low. Here are five takeaways every searcher, sponsor, and LP should be thinking about.
1. Pricing Reset: TTM Multiples at a 12-Quarter Low
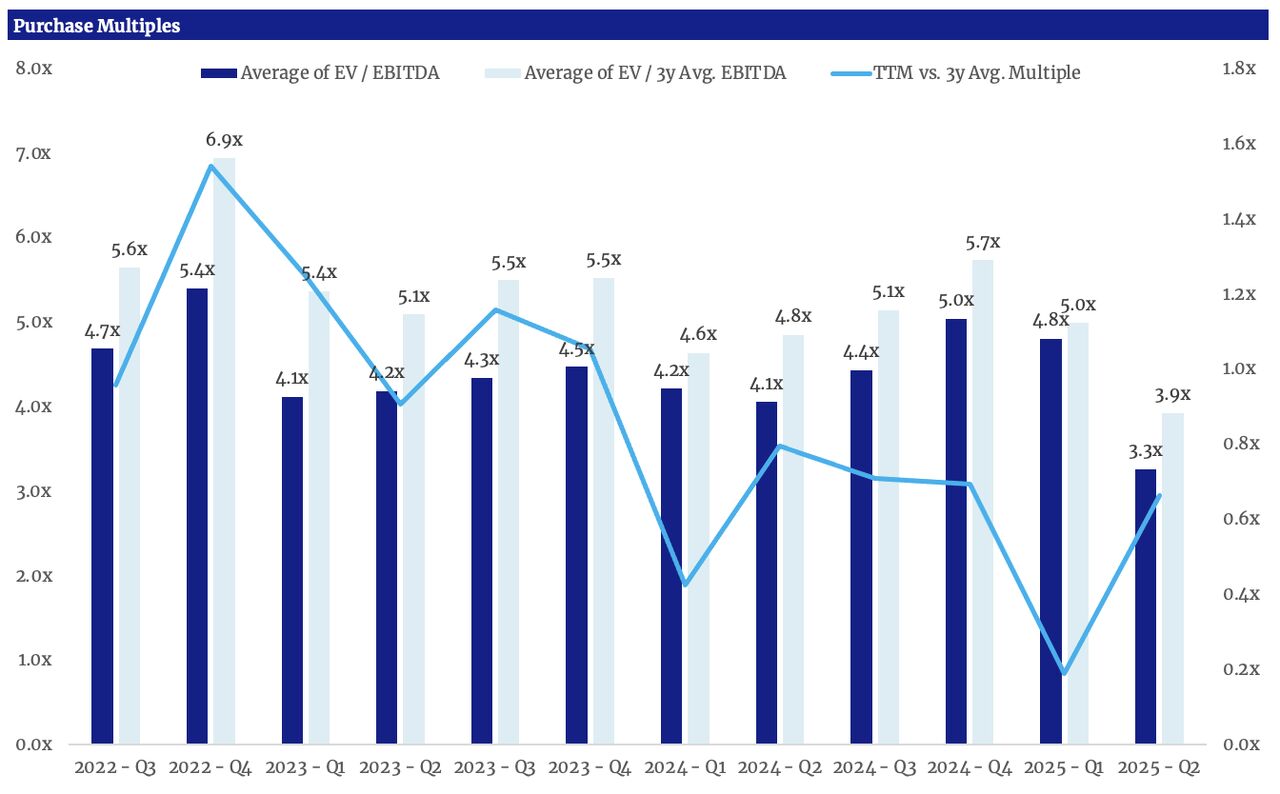
Average TTM EV/EBITDA multiples slid to 3.3x in Q2 2025 — the lowest reading in our 12-quarter dataset. The peak in this window was 5.4x in Q4 2022, and multiples have trended down with some quarter-to-quarter chop ever since.
Just as telling: the spread between TTM and 3-year average multiples has been compressing since Q4 2022. Buyers are no longer paying up for short-term performance — they are pricing on normalized, smoothed earnings. That's a healthier underwriting environment, but it also means sellers can't lean on a single peak year to justify valuation.
For the longer historical view, see our companion piece on SMB purchase multiples from 2015 to 2025, which shows the same compression playing out at the annual level.
2. Ask vs. Close Spread Widened
On average, deals in our Q2 2025 cohort closed 10.5% below asking. Brokered processes took an average of ~313 days from listing to close.
Two implications:
- Sellers are anchoring high. Initial asks are not pricing in the multiple compression. The negotiation gap has to be bridged in diligence and structure, not just at letter-of-intent.
- Time-to-close is the silent cost. ~313 days through a brokered process is a lot of operator distraction and deal-fatigue risk. This is one reason proprietary deal sourcing continues to outperform — relationship-driven processes typically clear faster and at better prices.
About the Author

Sean Smith
Managing Partner of Search Fund Ventures
Sean brings extensive experience in search funds and SMB acquisitions. He's built and scaled multiple businesses and now focuses on connecting investors with high-quality deal flow.
Connect on LinkedIn3. Earnings Stability Earned a Premium
Companies with steady, low-volatility earnings traded at a +0.4x premium to those with peaked or lumpy earnings histories.
This shows up in the chart as the narrowing TTM-vs-3-year spread: buyers are paying for businesses where the trailing 12 months looks like the trailing 36 months. Recurring revenue, contracted backlogs, and diversified customer concentration are the features that earn this premium today.
For LPs evaluating fund managers, this is one of the cleanest tests in how to evaluate an SMB fund: does the manager underwrite for stability, or for last year's growth?
4. Size Mattered Less Than Expected
We expected a meaningful step-up in multiples for businesses above $5M revenue. The actual premium was +0.3x vs. sub-$5M businesses — smaller than conventional wisdom suggests.
In the lower middle market, the multiple-arbitrage between $2M and $7M EBITDA businesses is narrower than the buyer pool generally believes. That has two implications:
- For searchers: chasing larger deals to get a "size premium" at exit may be a worse use of capital than buying smaller, well-priced businesses with cleaner operating profiles.
- For LPs: be skeptical of strategies pitched primarily on multiple arbitrage from "graduating" businesses up the size curve. The empirical premium isn't large enough to justify it on its own.
Download the SMB Investing Guide
Get our free playbook on search fund investing fundamentals, due diligence checklists, and portfolio construction strategies.
5. Working Capital: 10–20% of Purchase Price
Net working capital at close typically ran 10–20% of purchase price in our dataset, peaking in Q2. This is a critical line item that's often glossed over in SMB deal modeling — buyers who don't account for it correctly end up undercapitalized post-close.
For LPs, working capital structure is a clean diligence question: how does the manager handle NWC pegs, true-ups, and post-close adjustments? Inconsistent NWC discipline is a red flag.
The Takeaway: Silver Tsunami Hasn't Peaked
There are a lot of buyers in the market, but the data continues to suggest the Silver Tsunami of baby boomer business transitions has not peaked. Supply is outpacing demand, multiples are compressing, and the spread between TTM and 3-year averages has tightened — all signs of a buyer's market with room to run.
For the right buyer with the right sourcing engine, this remains one of the most attractive entry environments in a decade.
Want the full data? Read the complete Q2 2025 Closed Deals Report — it includes all charts, deal-level commentary, and quarterly breakdowns across the 584-deal dataset.
Related Reading
SMB Purchase Multiples 2015–2025: A Decade of Data
Average SMB acquisition multiples fell to 4.3x EBITDA in 2025, down from a 6.7x peak in 2017. What 10 years of data tells us about the lower middle market.
How to Evaluate an SMB Fund: A Framework for LP Investors
A practical framework for evaluating SMB fund opportunities, covering operator assessment, deal economics, portfolio strategy, and governance — with benchmarks from real market data.
The Silver Tsunami: Why 2026 Is the Best Time to Invest in Small Businesses
10M+ baby boomer business owners are retiring, creating unprecedented deal flow. Here's why smart investors are positioning now for the SMB acquisition wave.
Ready to get started?
Create your Investor Profile and start accessing exclusive deals and resources.